
Figure 5.
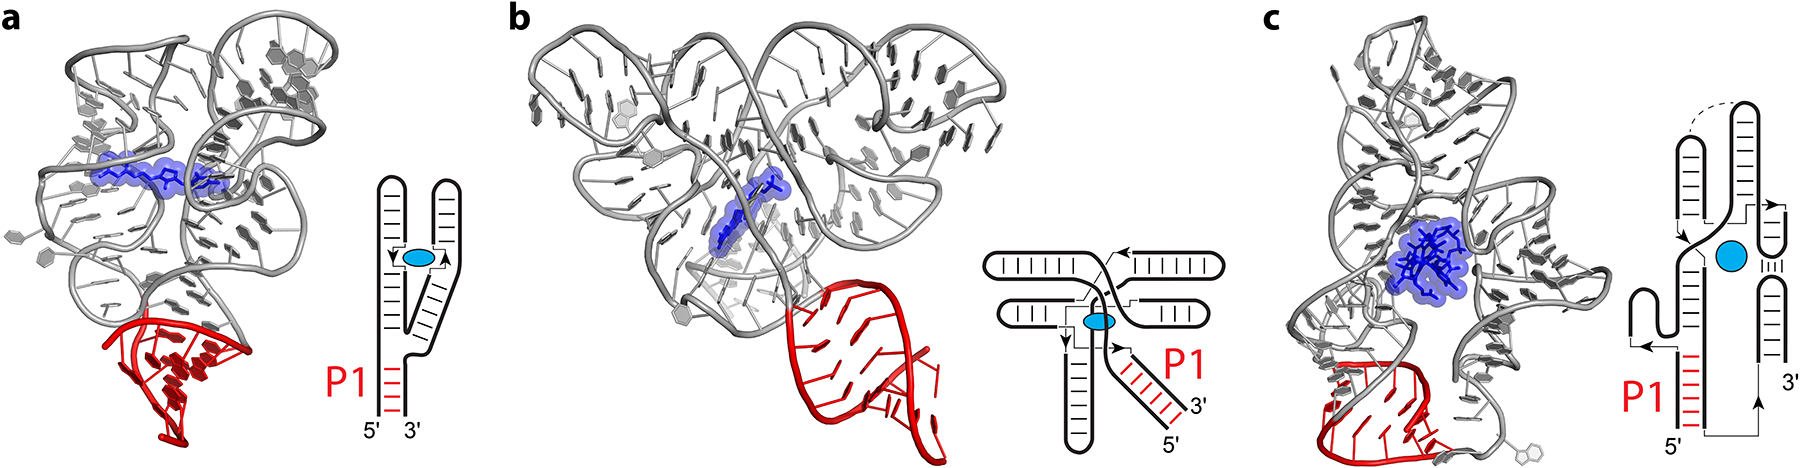
Distal riboswitches. Cartoon representations and secondary structure diagrams are shown for the TPP riboswitch (a) from Escherichia coli (97), the FMN riboswitch (b) from Fusobacterium nucleatum (159), and the cobalamin riboswitch (c) from an environmental sample (env8) (74). Ligands (blue) and the first paired region connecting the 5′ and 3′ ends (P1, red) are indicated. In the simplified secondary structure diagrams, thin lines and arrows indicate chain connectivity.