
Fig 2.
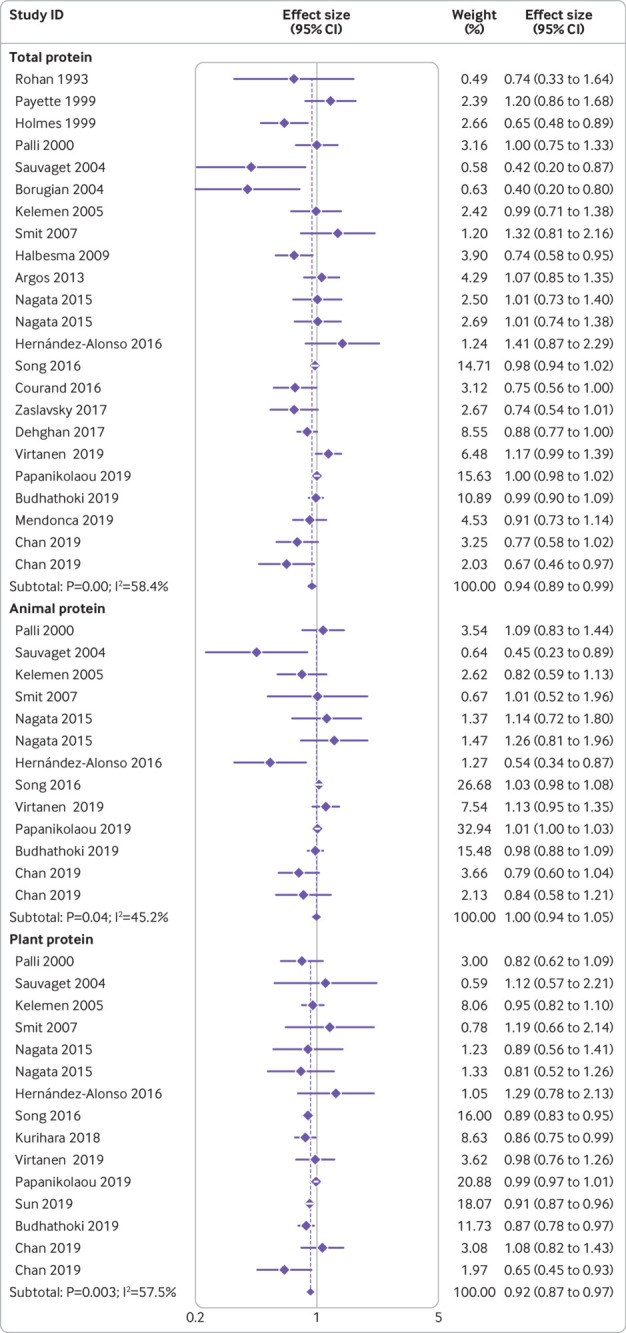
Forest plot for association between protein intake and risk of all cause mortality in adults aged 19 or older, expressed as comparison between highest and lowest categories of protein intake. Diamonds represent pooled estimates from random effects analysis