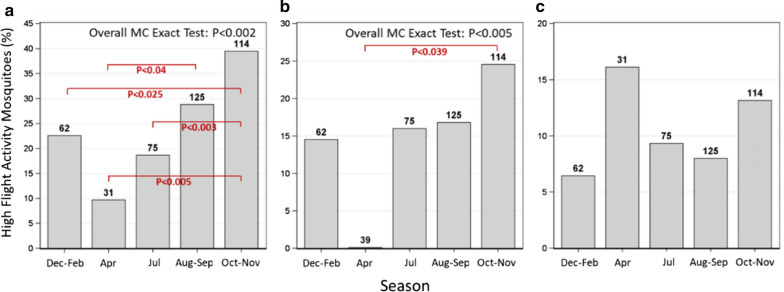
Fig. 5.
Variation of flight aptitude indices by season; longest flight (a), total flight (b), and flight bouts (c). Variation in Anopheles coluzzii flight aptitude between seasons; The x-axis depicts the different parts of the year (‘seasons’); Dec–Feb and Apr represent the dry season. Jul, Aug–Sep and Oct–Nov represent the wet season. Y-axis values are percent frequencies of the HFA populations, with n above each bar. Seasonal flight aptitude comparison was carried out on gravid An. coluzzii females, the only species which had samples across seasons

