Fig. 1.
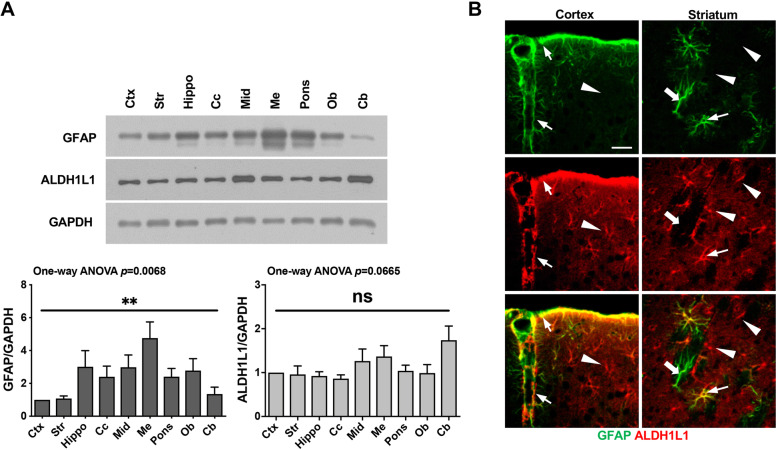
Differential expression of the astrocyte markers, GFAP and ALDH1L1, in different brain regions. a Tissue lysates were prepared from several brain regions. GFAP and ALDH1L1 protein levels in each brain region were analyzed by Western blotting. GAPDH was used as a loading control. Ctx, cerebral cortex; Str, striatum; Hippo, hippocampus; Cc, corpus callosum; Mid, midbrain; Me, medulla; Ob, olfactory bulb; and Cb, cerebellum. Band intensities were analyzed using Image J. Values are means ± SEMs of three samples (ns, not significant; **, p < 0.001; one-way ANOVA, GFAP: F (8, 36)=3.261, p = 0.0068; ALDH1L1: F (8, 36)=2.060, p = 0.0665). b Sections obtained from the cortex and striatum were stained with antibodies against GFAP and ALDH1L1, and immunoreactive proteins were visualized using Alexa 488- and 594-conjugated secondary antibodies. Three types of astrocytes were detectable in the cortex and the striatum: GFAP and ALDH1L1 double-positive (thin arrows), GFAP-positive/ALDH1L1-negative (thick arrows), and ALDH1L1-positive/GFAP-negative (arrowheads). Scale bar, 10 μm. Data are representative of at least 3 animals

