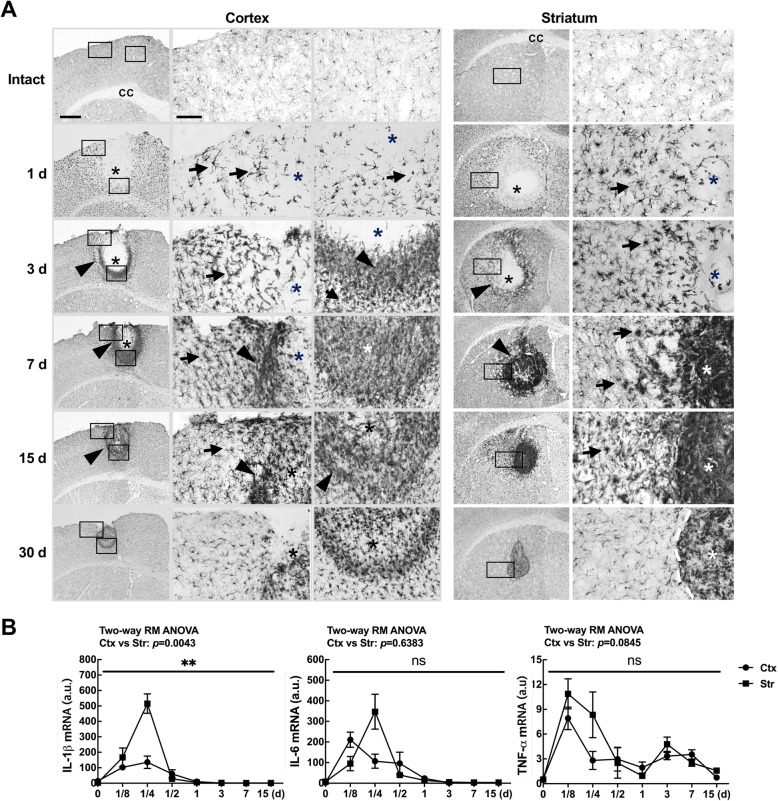
Fig. 5.
Inflammatory responses in the injured cortex and striatum. a Sections from the cortex and striatum were immunostained for Iba-1 at the indicated times post injection. Photographs of the most damaged sections are shown. Arrows, Iba-1-positive cells with a hypertrophic morphology; arrowheads, Iba-1–positive cells at the boundary of injury sites. b At the indicated times after ATP injection, IL-1β, IL-6, and TNF-α mRNA levels were analyzed using RT-qPCR. Values are means ± SEMs of 5 animals for both cortex and striatum (*, p < 0.05; ***, p < 0.001; ns, not significant; two-way ANOVA, IL-1β: F(7, 56) = 14.03, p < 0.0001, interaction; F(2.091, 16.73) = 39.77, p < 0.0001, time; F (1, 8)=15.52, p = 0.0043, region; F(8, 56) = 0.964, p = 0.4731, subjects; IL-6: F(7, 56) = 6.29, p < 0.0001, interaction; F(2.031, 16.10) = 17.41, p < 0.0001, time; F (1, 8)=0.2387, p = 0.6383, region; F(8, 56) = 1.515, p = 0.1728, subjects; TNF-a: F(7, 56) = 1.842, p = 0.0972, interaction; F(2.772, 22.17) = 12.03, p < 0.0001, time; F (1, 8)=3.876, p = 0.0845, region; F(8, 56) = 0.7877, p = 0.6154, subjects)

