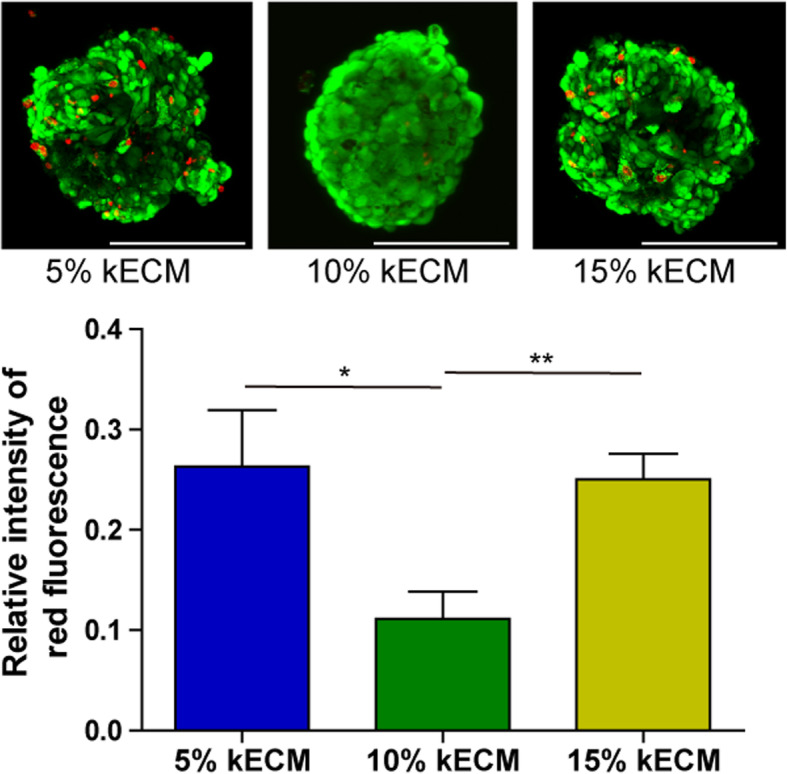
Fig. 3.

kECM concentration optimization via viability assay. Live/Dead staining was employed to evaluate the viability of USC-organoids in different kECM concentration. Green fluorescence indicated live cells, and red fluorescence-labeled dead cells. The red fluorescence intensity was quantified. With low kECM concentration, the 3D cell culture simulation effect was poor, and the ability to obtain renal cell phenotype was also poor. Otherwise, high kECM concentration would affect the viscosity of the medium and finally influence nutrition penetration. From the figure, the 10% kECM was the optimal concentration for organoid formation (scale bar 200 μm)
