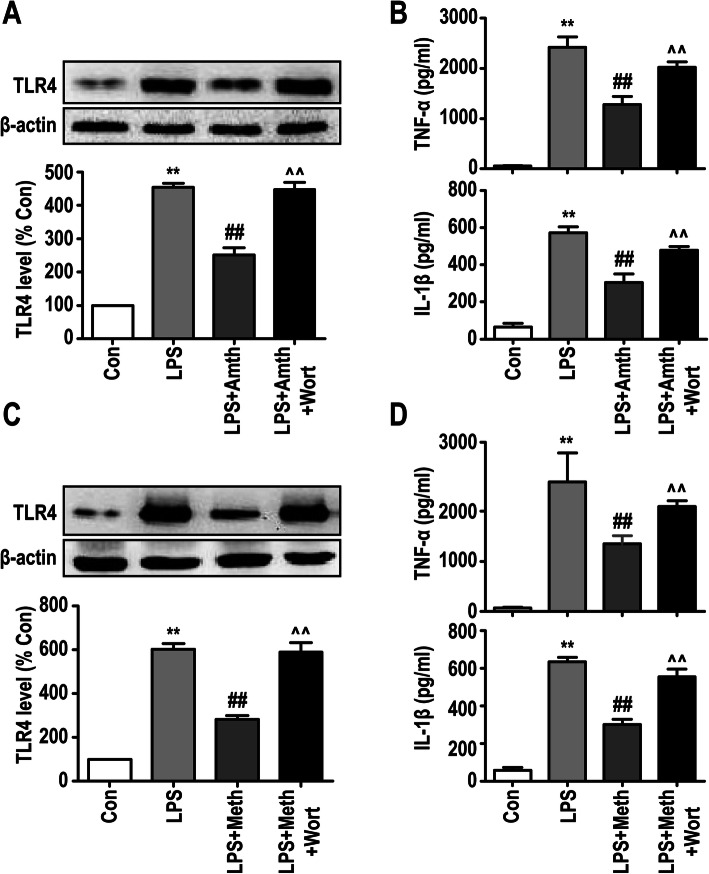
Fig. 8.
An agonist of H2R or H3R inhibits LPS-induced TLR4 expression by activating PI3K/AKT signaling. a, c The protein levels of TLR4 were detected by Western blotting using specific antibody in primary microglia, and expression of TLR4 was quantified and normalized to β-actin levels. Each value was expressed relative to that in the control group, which was set to 100. b, d Concentration of TNF-α and IL-1β measured by ELISA. **P < 0.01 versus the control group. ##P < 0.01 versus the LPS group. ^^P < 0.01 versus the LPS + Amth group. ^^P < 0.01 versus the LPS + Meth group (n = 3). The data are presented as the mean ± SEM

