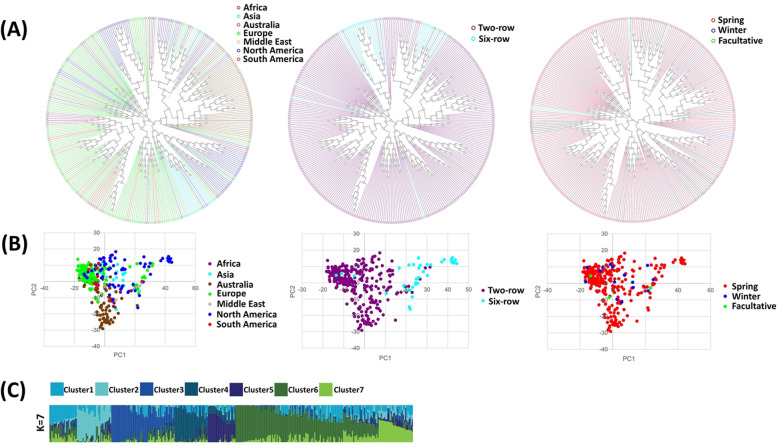
Fig. 2.
Population structure analysis of 328 barley accessions. (a) Phylogenetic neighbour-joining (NJ) tree of 328 barley accessions constructed based on genetic distances, highlighting their origins, row types and growth habits in different colours. (b) Principal component analysis (PCA) of 328 barley accessions using the first two components, according to their origins, row types and growth habits. (c) Population structure using ADMIXTURE for 328 worldwide barley genotypes with 19,014 SNPs. The subpopulations are presented in different colours, and the proportional membership in the population is indicated by the colour of the individual haplotypes. The CLUMPP was used to merge the membership coefficients across 100 replicate runs. According to the CV error, the K value (number of clusters) in the population of 328 accessions was determined to be 7

