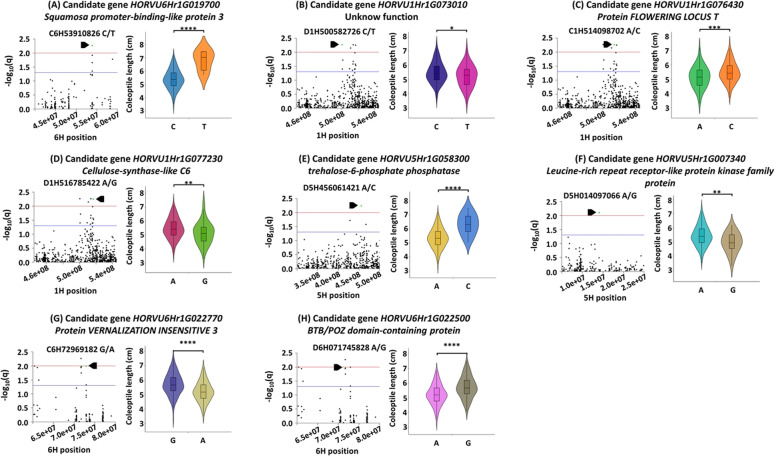
Fig. 3.
The genomic regions of eight candidate genes had signals strongly associated with coleoptile length. Each included the Manhattan plot showing the physical position on the chromosome (left) and the coleoptile length variation between different alleles (right). For the Manhattan plot, the q-values (−log10 of FDR adjusted P-values) were used to assess the association significance, and the signal with highest association (−log10(q) > 2) for each candidate gene was indicated in green colour. The threshold of MTA significance was determined by q-value cut-off at 0.05 and 0.01 and indicated by horizontal lines in different colours (0.05 (blue) and 0.01 (red)). For the coleoptile length variation plot, * p < 0.05; ** p < 0.01; *** p < 0.001; **** p < 0.0001. The coleoptile length was averaged from the sixteen biological and three technical replicates

