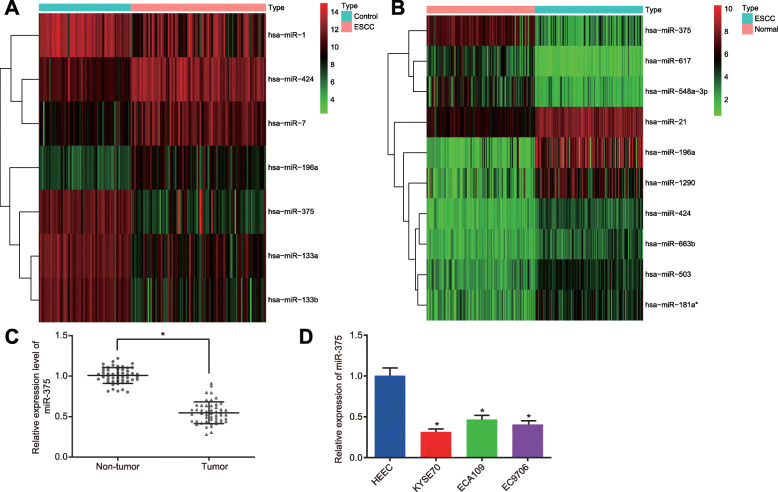
Fig. 1.
ESCC correlated to low expression of miR-375. A, Heatmap of the top ten miRNAs with the largest fold change in the GSE6188 dataset. B, Heatmap of the top ten miRNAs with the largest fold change in the GSE55856 dataset. In panel A and B, the abscissa represents sample number and the ordinate represents differentially expressed miRNAs. The upper right histogram shows a color scale, where each rectangle shows the expression of an individual sample. C, Expression of miR-375 was determined by RT-qPCR in ESCC tissues and adjacent normal tissues (n = 50), relative to U6. D, Expression of miR-375 was measured by RT-qPCR in KYSE70, ECA109, EC9706 and HEEC cells, relative to U6. * p < 0.05 vs. adjacent normal tissues by paired t-test or HEEC cells by one-way ANOVA. Data were shown as mean ± standard deviation of three technical replicates

