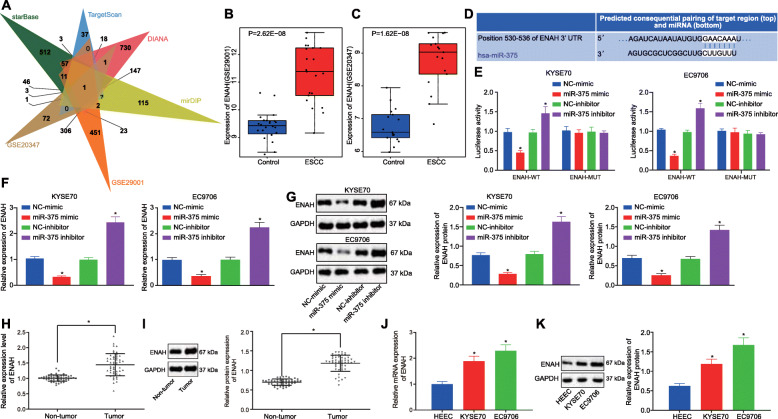
Fig. 3.
ENAH was highly expressed in ESCC and targeted by miR-375. A, Venn diagram showing target genes of miR-375 predicted by the starBase, TargetScan, DIANA, and mirDIP databases and DEGs in ESCC-related GSE29001 and GSE20347 microarray datasets. B, Expression of ENAH in ESCC and adjacent normal tissues in the GSE29001 dataset. C, Expression of ENAH in ESCC and adjacent normal tissues in the GSE20347 dataset. D, Putative miR-375 binding sites in the 3’UTR of ENAH mRNA in the TargetScan website (http://www.targetscan.org/vert_71/). E, Luciferase activity of ENAH-3’UTR-WT and ENAH-3’UTR-MUT in cells in the presence of miR-375 detected by dual-luciferase reporter gene assay. F, The mRNA expression of ENAH was determined by RT-qPCR in KYSE70 and EC9706 cells following enhancement or inhibition of miR-375, relative to GAPDH. G, The protein expression of ENAH was determined by western blot analysis in KYSE70 and EC9706 cells following enhancement or inhibition of miR-375, relative to GAPDH. H, The mRNA expression of ENAH was determined using RT-qPCR in ESCC tissues and adjacent normal tissues (n = 50), relative to GAPDH. I, The protein expression of ENAH was determined using western blot analysis in ESCC tissues and adjacent normal tissues (n = 50), relative to GAPDH. J, The mRNA expression of ENAH was determined by RT-qPCR in KYSE70, EC9706 and HEEC cells, relative to GAPDH. K, The protein expression of ENAH was determined by western blot analysis in KYSE70, EC9706 and HEEC cells, relative to GAPDH. Data in panel H and I were analyzed using paired t-test, in panel B and C were compared using independent sample t-test while in panel E-G, J and K were analyzed using one-way ANOVA. * p < 0.05 vs. cells transfected with NC-mimic or NC-inhibitor, adjacent normal tissues, or HEEC cells. Data are shown as mean ± standard deviation of three technical replicates

