Fig. 5.
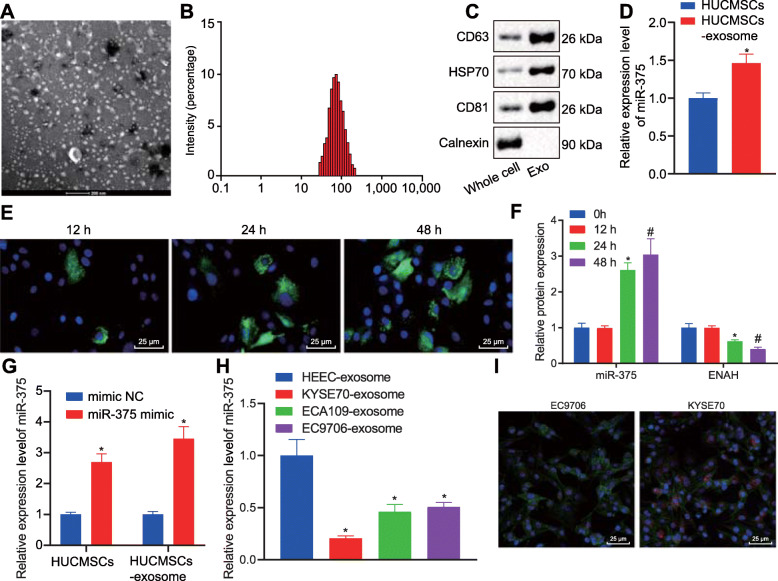
miR-375 was delivered into KYSE70 cells via hUCMSCs-exo. A, Morphological changes of hUCMSCs-exo observed under a TEM (scale bar = 200 nm). B, Diameter of hUCMSCs-exo analyzed using Zetasizer Nano ZS. C, Representative Western blots of hUCMSCs-exo surface marker (HSP70, CD63, and CD9) proteins and their quantitation in hUCMSCs and hUCMSCs-exo, relative to GAPDH. D, miR-375 expression was determined by RT-qPCR in hUCMSCs and hUCMSCs-exo, relative to U6. E, Uptake of hUCMSCs-exo by KYSE70 cells was observed under a fluorescence microscope (scale bar = 25 μm). F, Expression of miR-375 and ENAH was determined by RT-qPCR in KYSE70 cells at 12 h, 24 h, and 48 h, relative to U6. G, miR-375 expression was determined by RT-qPCR in hUCMSCs transfected with miR-375 mimic and the derived exosomes, relative to U6. H, Expression of miR-375 was examined by RT-qPCR in KYSE70-exosomes, ECA109-exosomes, EC9706-exosomes and HEEC-exosomes, relative to U6. I, Representative fluorescence microscopic images of miR-375 delivered into KYSE70 cells from hUCMSCs (scar bar = 25 μm). Cy3-labeled miR-375 presented in red; KYSE70 cells were stained in green; DAPI-labeled nucleus was stained in blue. Data in panel C, D, G and I were compared using t-test while data in panel F and H were analyzed using one-way ANOVA. * p < 0.05 vs. hUCMSCs, expression in KYSE70 cells at 12 h, or hUCMSCs transfected with NC-mimic. Data are shown as mean ± standard deviation of three technical replicates

