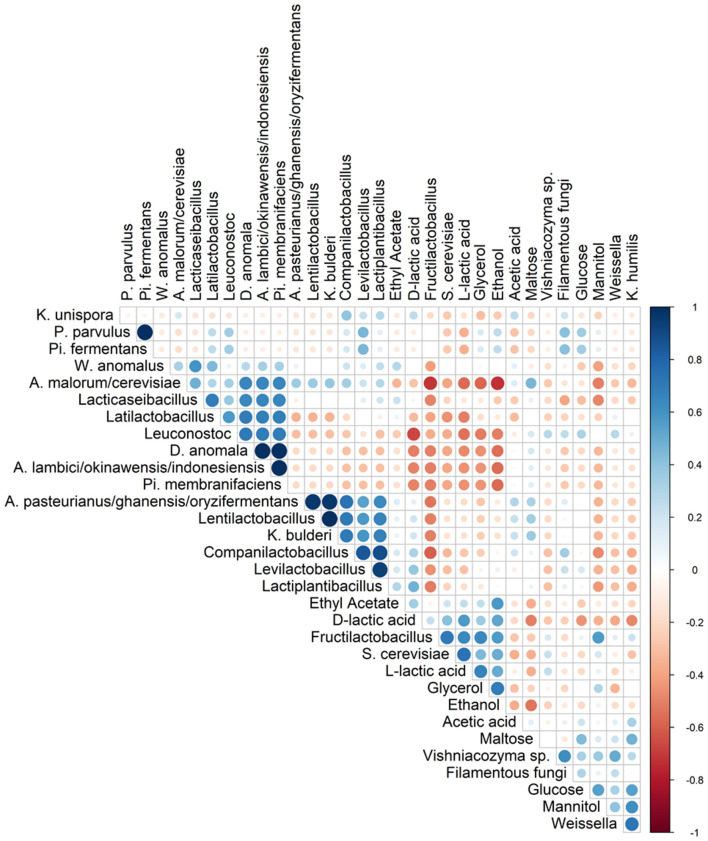
Figure 5.
Spearman correlation analysis between the different species (based on metagenetic analysis) and/or dedicated substrates consumed, and metabolites produced in 17 sourdough samples from backslopped sourdoughs of different origins. Positive and negative correlations are represented in blue and red, respectively. The size of the circle represents the numerical value of the correlation coefficient.

