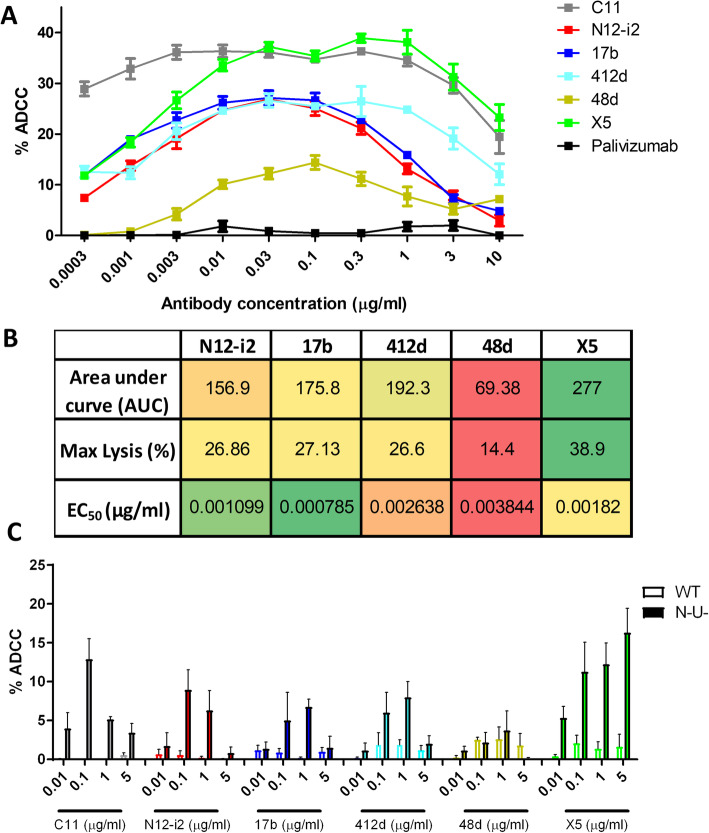
Fig. 5.
ADCC to gp120-coated and ADA-infected target cells. a RFADCC using gp120-coated GFP-CEM-NKR-CCR5-SNAP target cells over a range of antibody concentrations (0.0003–10 μg/ml) displayed as % killing. n = 3, mean ± SEM. Anti-Cluster A antibody C11 and palivizumab were used as positive and negative controls, respectively. b Heat map showing the ADCC activity measures as area under the curve (AUC), maximum lysis and EC50 for all five CoRBS antibodies in the RFADCC assay. c ADCC against pNL4/ADA and pNL43/ADA/N-U- infected CEM-NKR target cells over a range of antibody concentrations. N = 3, mean + SEM, individual data is displayed in Additional files 7 and 8

