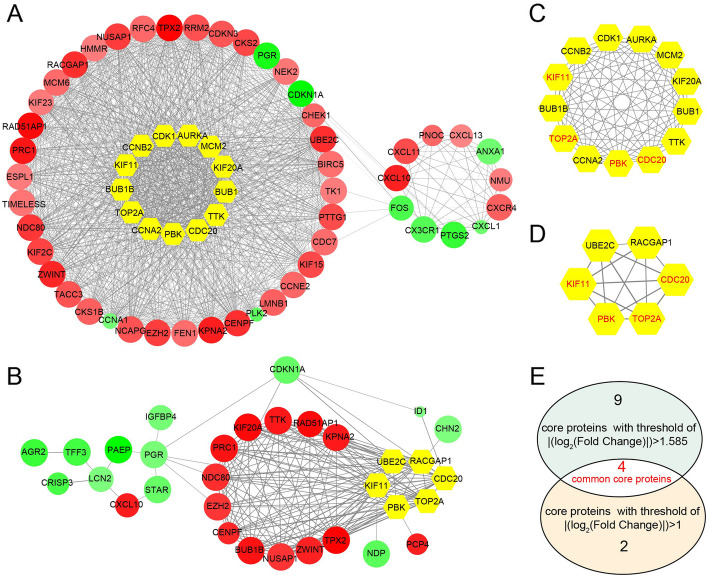
Fig. 3.
PPI network of 248 DEGs using |log2FoldChange| > 1.0 as screening index (a) and PPI network of 59 DEGs using |log2FoldChange| > 1.585 as screening index. The color of nodes is according to log2FoldChange, red nodes denotes up-regulated DEGs which log2FoldChange > 0 and green nodes denotes down-regulated DEGs which log2FoldChange < 0. The width of edge is positive correlation with combined score of protein interaction. The size of nodes is based on p-value. Yellow nodes denotes core DEGs also called hub genes. Hub genes were screened out from 248 DEGs (c) and from 59 DEGs (d) respectively. The intersection of two hub genes were obtained according to different filter criteria (e). Common hub DEGs were marked red

