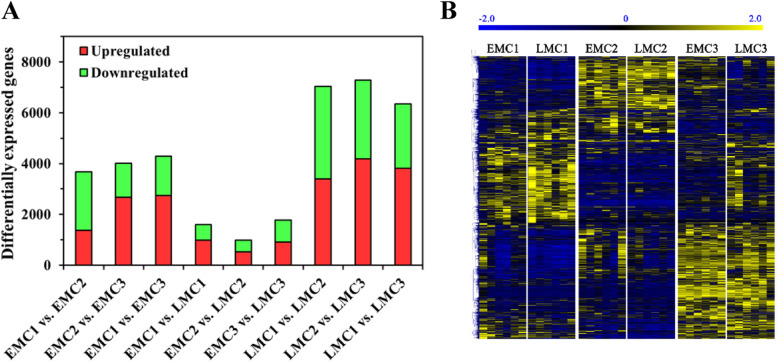
Fig. 2.
Differentially expressed genes between male cones of EPs and LPs. a The number of differentially expressed genes among different sample groups. EMCs and LMCs indicate male cones of EPs and LPs, respectively. The numerical order indicates different sampling times (Fig. 1). Using a threshold value of P < 0.01 for filtering differentially expressed genes, a total of 8342, 13405, and 3484 genes were identified between EMCs and LMCs at different time points, and between EMCs and LMCs at the same time point. b The 6898 genes that were significantly differentially expressed between the two sample groups (P < 0.01, effect size ≥1) are shown in the heat map. Differences were mainly present among sample groups at different time points rather than between EPs and LPs

