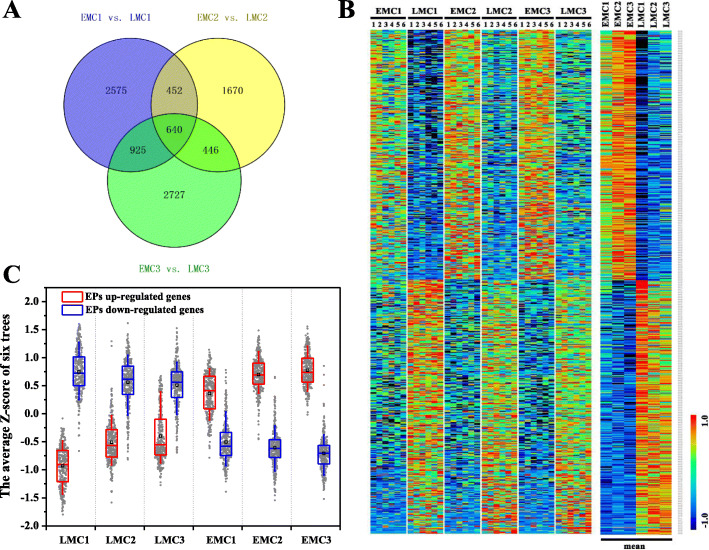
Fig. 4.
Expression patterns of genes that were stably differentially expressed between EMCs and LMCs at every time point. a A total of 640 differentially expressed genes overlapped between EMCs and LMCs at every time point (P < 0.05). b Heat map of 640 genes in EMCs and LMCs. The data from six biological replicates are shown individually on the left, and shown as averages on the right. The data were normalised by Z-score transformation. c The expression pattern shifts of 640 genes during male cone development in the spring. The boxes represent the median and 25th–75th percentiles of the Z-scores of two sets of genes, and the whiskers represent the 10th and 90th percentiles. The grey data points represent the Z-score distribution. The mean Z-score values of six biological replicates were used. The red box and blue box represent genes with higher and lower expression levels in EMCs and LMCs, respectively

