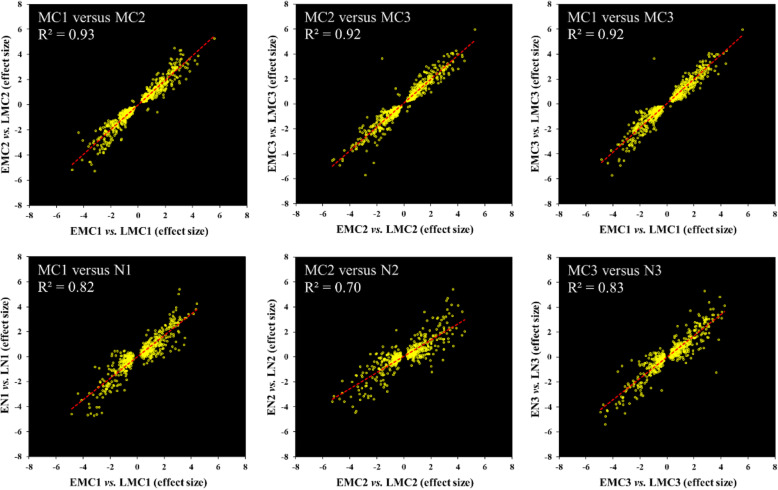
Fig. 5.
The transcriptional differences between EPs and LPs were consistent in male cones and needles. Scatter plots of effect sizes of EMC/LMC and EN/LN and Pearson correlations indicate that the transcriptional profiles of needles and male cones were strongly correlated. The top panel is based on all 640 genes, and the bottom panel shows the 512 genes that were expressed (mean TPM > 1) in needles. MC, male cones; EMC and LMC, male cones from EPs and LPs, respectively; N, needles; EN and LN, needles from EPs and LPs, respectively. The numerical order indicates the different sampling times

