Fig. 9.
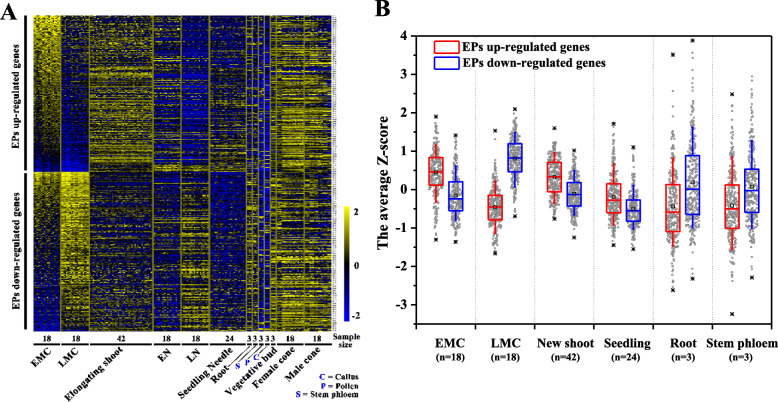
Expression patterns of EP- and LP-preferred transcriptional modules under different conditions. a The expression profiles of 640 genes, in a total of 189 P. tabuliformis samples under a variety of growth and treatment conditions, are shown in the heat map. The data were normalised by Z-score transformation. EMC and LMC indicate male cones of EPs and LPs, respectively; EN and LN indicate needles of EPs and LPs, respectively; the elongating shoots were sampled from trees of different ages in the spring; seedling needles were sampled from 1-month-old seedlings under different photoperiods, including long day (16 h: 8 h), short day (10 h: 14 h) and control (14 h: 10 h), and different light conditions (red, far red and bright light). Different tissues (needles, roots, pollen, stem phloem, vegetative buds, and developing male and female cones) were sampled from 33-year-old trees in the spring. Callus was induced from hypocotyls. b Expression patterns of 640 genes in different tissue types. The mean Z-score values of all biological replicates were used. The boxes display the first quartile, median, and third quartile data, the whiskers range from 10 to 90%, and * indicates the minimum and maximum data. The distribution of the data is represented as a scatter plot. The red box and blue box represent genes with higher and lower expression levels in EMCs than LMCs, respectively

