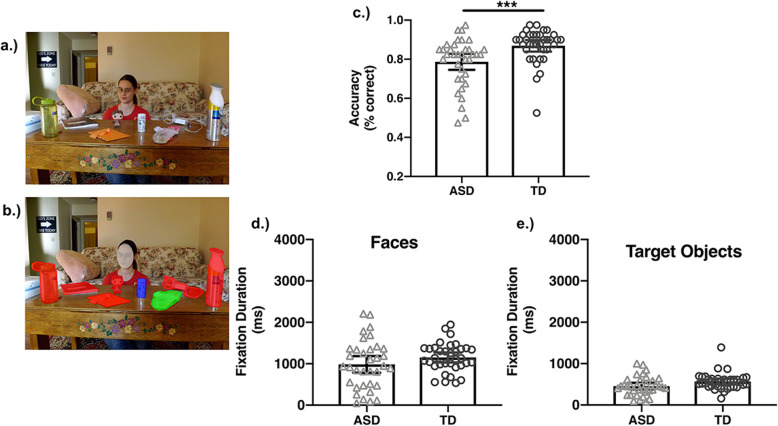
Fig. 3.
Gaze perception stimuli and results. Example image used in Gaze Perception Task (a). The areas of interest for the fixation analyses are illustrated in b. The target object is in green, the plausible non-target object is in blue, and the implausible non-target objects are in red. The face is in grey. Task performance (% correct) is plotted as a function of group (c). Fixation durations to faces (d) and target objects (e) are also plotted separated by group. Error bars reflect 95% confidence intervals. All analyses used mixed-effects modeling of trial-level data; however, for visualization these plots reflect the mean-level data. ***p < .001

