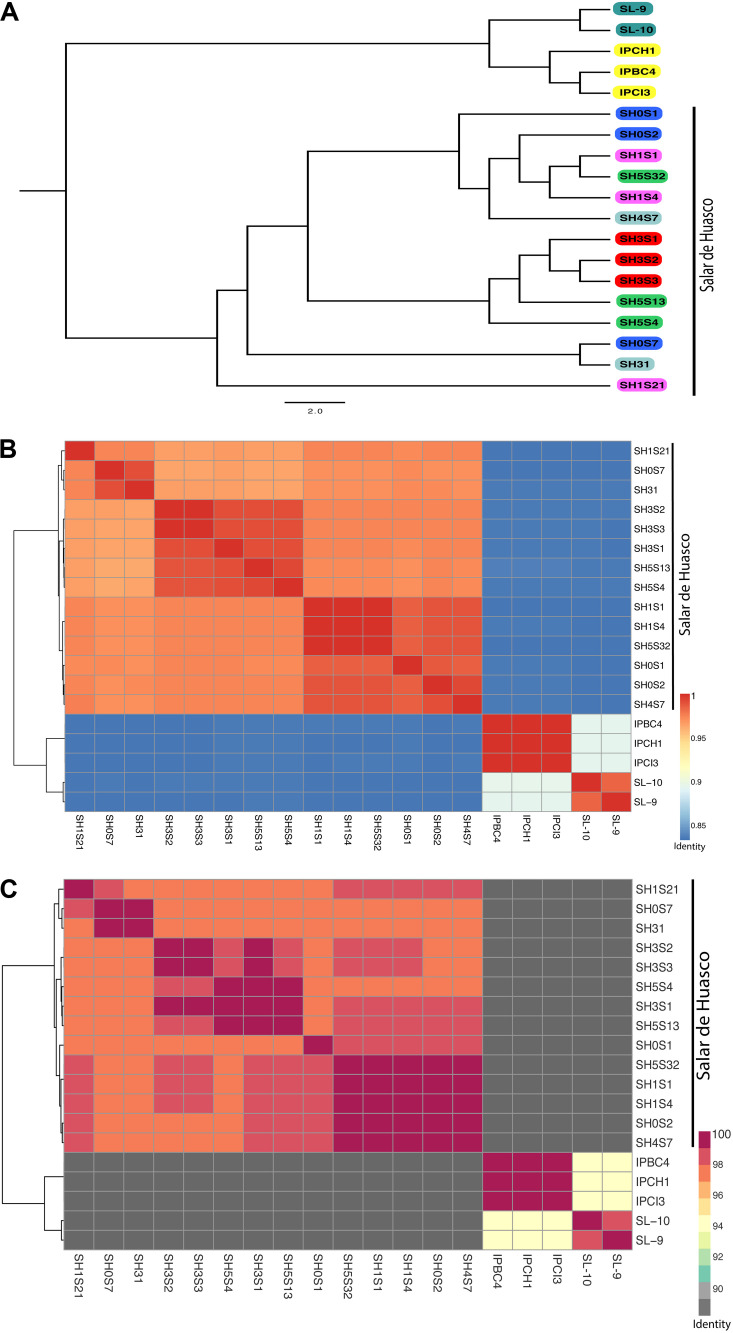
FIGURE 2.
Genomic relationships among Exiguobacterium strains. (A) Mid-point rooted Phylogenetic tree inferred from an alignment of 31 conserved genes. Strains in the tree are color coded by isolation site (Great Salt Lake are turquoise; Easter Island are yellow and Salar de Huasco: H0 site - blue; H1 site - pink, H3 site - red, H4 site - gray and H5 site - green. (B) Average nucleotide identity (ANI) heatmap. (C) Average amino-acid identity (AAI) heatmap. Hierarchical clustering of the Exiguobacterium genomes based on their average nucleotide/amino-acid identity values. The color gradients show the percentage of identity, from lowest to highest, that each pair of genomes shares.

