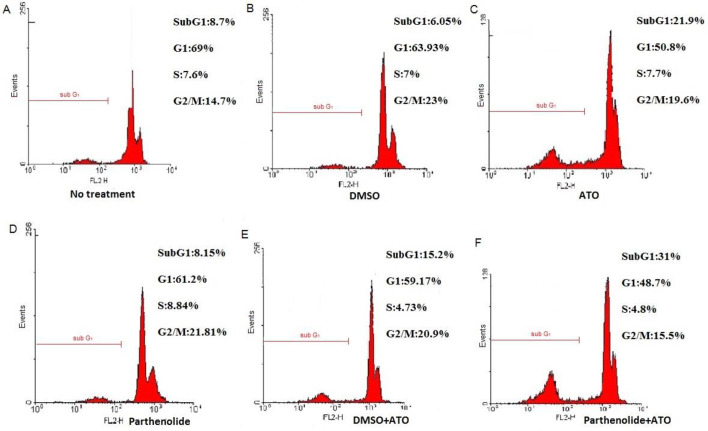
Figure 2.
MT2 cell cycle analysis by PI staining. Untreated cells (A), cells treated with 0.2% DMSO (B), 2 µM ATO (C), 1 µg/ml parthenolide (D), 0.1% DMSO + 2 µM ATO (E), and 1 µg/ml parthenolide + 2 µM ATO (F) for 72 hr. Sub-G1 peak, as an indicative of apoptotic cells, was specifically induced after parthenolide + ATO combination
ATO: Arsenic trioxide; DMSO: Dimethyl sulfoxide

