Fig. 3.
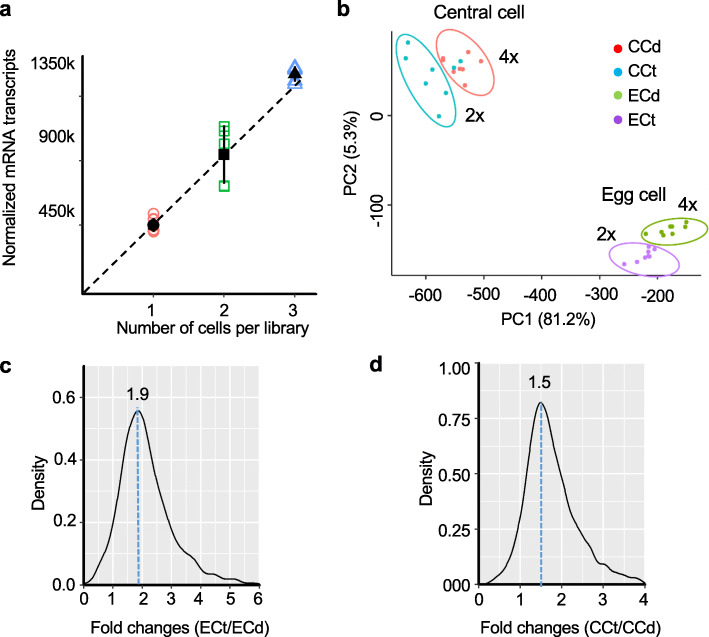
scRNA-seq analysis in egg and central cells in diploid and tetraploid plants. a A linear relationship between the total number (k = thousand) of normalized transcripts and the number of cells per library. Black dots indicate mean values with standard deviations of the total number of normalized mRNA transcripts estimated from 8 replicates for 1 cell and 5 replicates each for 2 and 3 cells. b Principal component analysis (PCA) of scRNA-seq data. ECd and ECt: egg cells in diploid and tetraploid plants, respectively; CCd and CCt: central cells in diploid and tetraploid plants, respectively. c, d Kernel density estimates of expression fold changes in the egg cells of tetraploid (ECt) and diploid (ECd) plants (c) and in the central cells of tetraploid (CCt) and diploid (CCd) plants (d)

