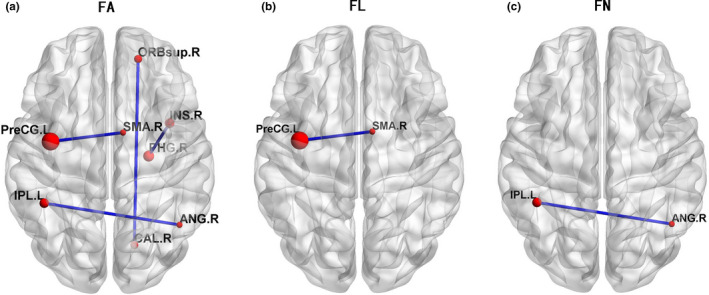
FIGURE 5.

Each red node represents a cortical region of the AAL template. The edges between two seeds were weighted by averaged FA, FL, or FN value. Compared with HCs, the significantly reduced value of fractional anisotropy (FA) (p < .05 FDR corrected), fiber length (FL) (p < .001), and fiber number (FN) (p < .001) in patients with glioma was presented in Figure a‐c, respectively.
