FIGURE 3.

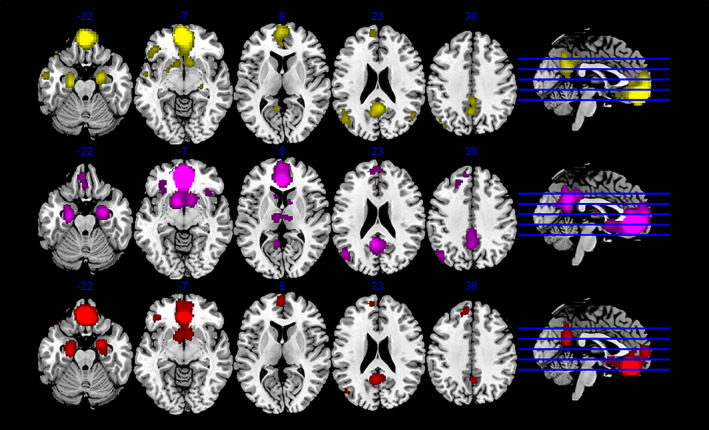
MACM plots for each of the anterior subregions. Clusters color‐coded as previously—top to bottom: 2 = yellow, 3 = magenta, 5 = red. MACM, meta‐analytic connectivity modeling

MACM plots for each of the anterior subregions. Clusters color‐coded as previously—top to bottom: 2 = yellow, 3 = magenta, 5 = red. MACM, meta‐analytic connectivity modeling