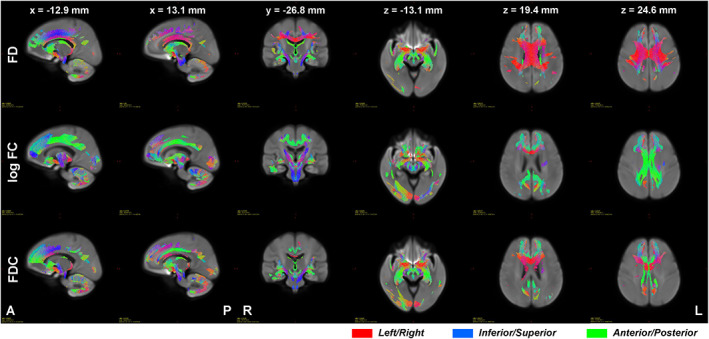
FIGURE 3.

Streamlines where significant (family wise error [FWE]‐corrected p < .05) negative relationship between FD (top row), log FC (middle row), and FDC (bottom row) and age were observed. Color encodes fiber direction with red for left–right, blue for inferior–superior, and green for anterior–posterior axes. Images are presented using radiological convention where the left hemisphere of the brain is shown at the right side of the image. A, anterior; FC, fiber cross section; FD, fiber density; FDC, FD and cross section; L, left; P, posterior; R, right
