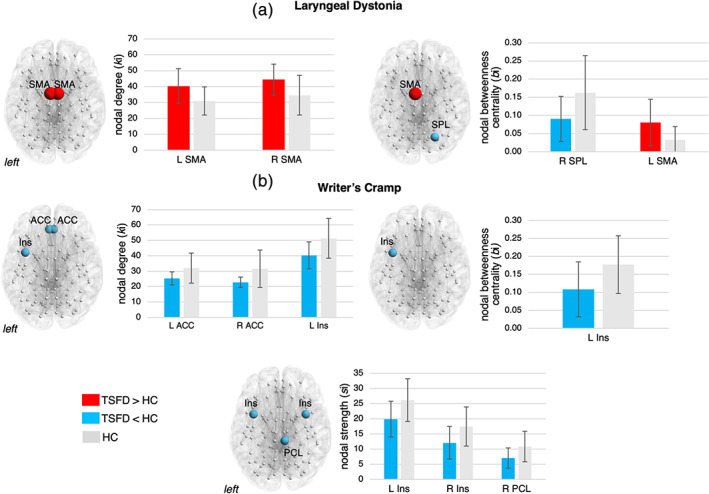
FIGURE 4.

Significant regional alterations of the structural connectome of dystonia patients compared to healthy controls. 3D brain renderings and bar graphs show significant regional changes in nodal degree, nodal strength, and betweenness centrality in (a) patients with laryngeal dystonia and (b) patients with writer's cramp compared to healthy controls, respectively. Error bars show SD; red bars indicate increases in nodal measures in patients compared to controls; blue bars depict decreases in nodal measures in patients compared controls; gray bars show the normative values in healthy controls. ACC, anterior cingulate cortex; HC, healthy controls; Ins, insula; L, left; PCL, paracentral lobule; R, right; SMA, supplementary motor area; SPL, superior parietal lobule; TSFD, task‐specific focal dystonia
