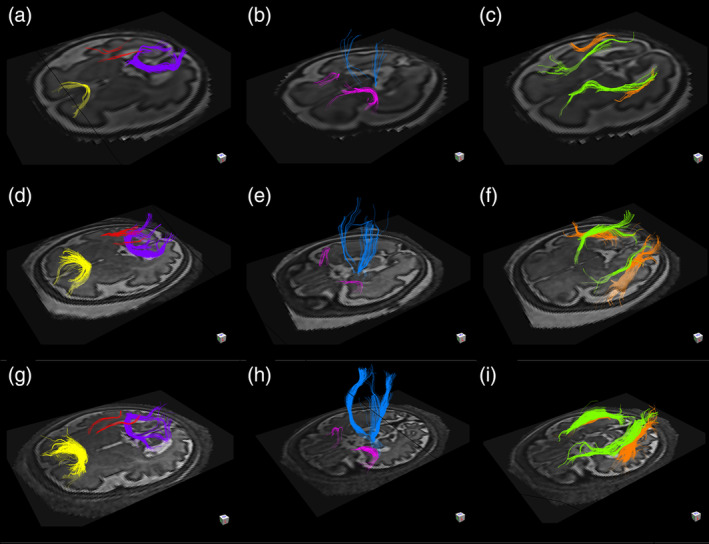
FIGURE 1.

Results of in vivo tractography analysis of fetuses at 29 weeks and 3 days (a–c), 32 weeks and 5 days (d–f), and 36 weeks and 1 day (g–i) gestational age. The forceps minor (yellow), the forceps major (purple), and the superior cingulum (red) are depicted in figure parts (a,d,g). The corticospinal tracts (blue) and the uncinate fasciculi (pink) are depicted in figure parts (b,e,h). The inferior longitudinal fasciculi (orange) and the inferior fronto‐occipital fasciculi (green) are depicted in figure parts (c,f,i)
