
Fig. 3. CSF influx is triggered by spreading depolarizations (SD) after focal ischemia.
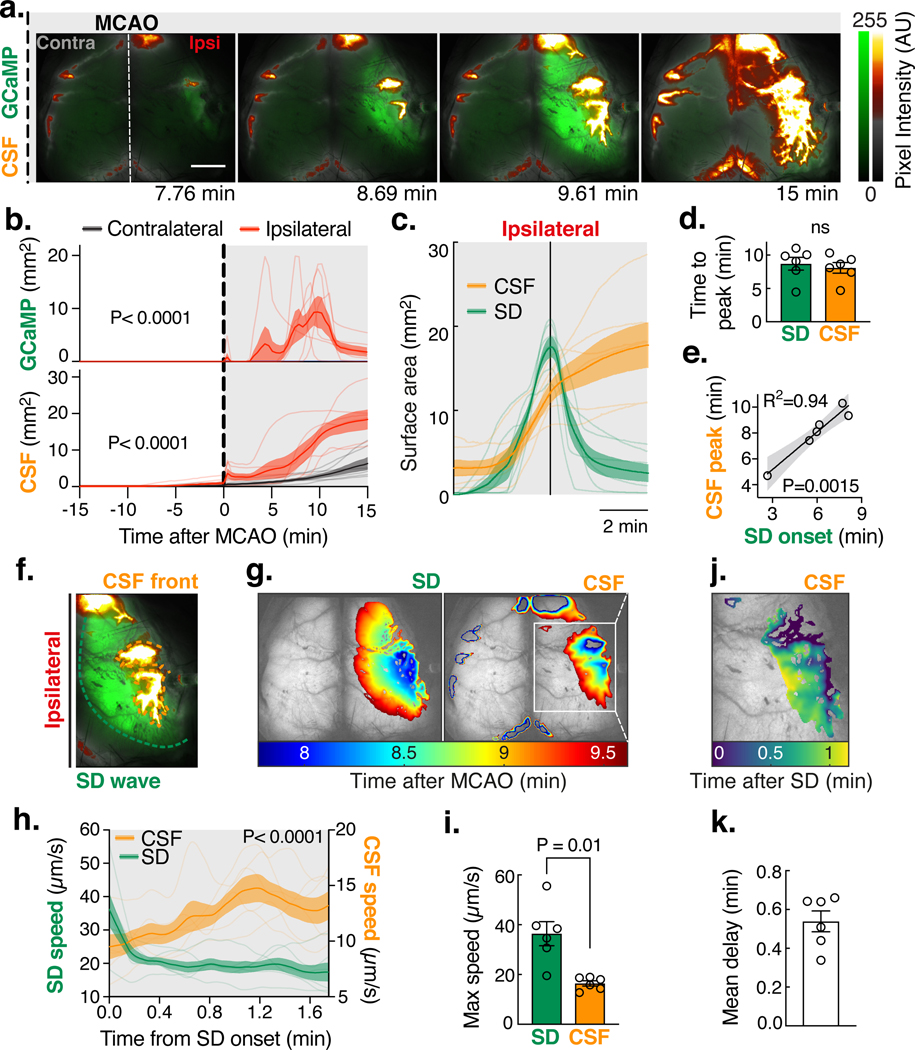
(A) A fluorescent CSF tracer (BSA-594) was delivered into the cisterna magna of Glt1-GCaMP7 mice 15 min before MCAO and imaged using a dual channel macroscope for 15 min as done in Fig. 1d. Pixel intensity in arbitrary units (AU). Scale bar: 2 mm. (B) Area covered by GCaMP and CSF tracer fluorescence. Repeated measures two-way ANOVA with Sidak’s multiple comparisons test; interaction P value; n=6 mice. (C) CSF tracer surface area aligned to the SD (GCaMP) peak. (D) Time to peak influx rate for the SD (GCaMP) and the CSF tracer. Paired t-test. (E) Linear regression of CSF peak influx and SD onset time with 95% confidence intervals. (F) The fronts of the ipsilateral SD wave and the CSF tracer were tracked. (G) Area covered by the SD (left panel) and the CSF tracer (right panel) over time. (H) Front speed of the SD wave and the CSF front. Repeated measures two-way ANOVA with Sidak’s multiple comparisons test; interaction P value. (I) Maximum speed of the SD and CSF front. Paired t-test. (J) Delay time between the SD wave and the CSF tracer front. (K) Mean delay between the SD and CSF front.