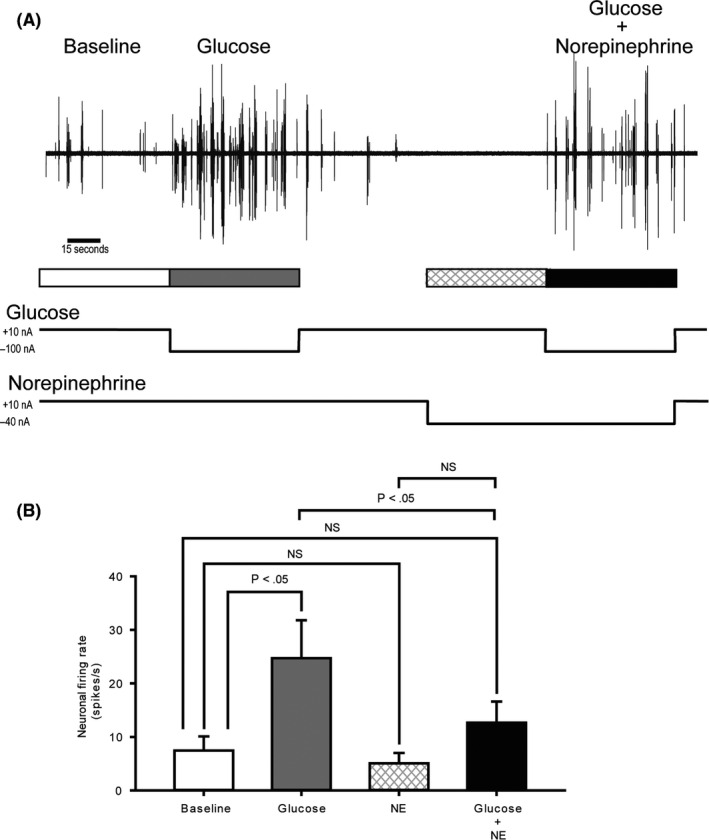
FIGURE 8.

VMH GE neuronal response to local glucose increase is suppressed by local norepinephrine administration. A, Example voltage traces from five‐minute multi‐unit recordings (MUA) obtained from VMH. After 60 seconds of recording spontaneous activity (baseline firing rate, white), glucose was iontophoretically (electro‐osmotically) applied for 60 seconds (grey). After glucose injection, 60 seconds was given to allow cells to return to baseline firing rates (white), and then norepinephrine (NE) was iontophoretically applied initially for 60 seconds (hatched) and then continued for another 60 seconds during which time glucose was co‐administered (black). B, The average MUR from the VMH of 10 animals during baseline (white), glucose stimulation (grey), norepinephrine (hatched) and glucose plus norepinephrine pretreatment (black) conditions at the VMH. Error bars depict the s.e.m. See Methods section for details
