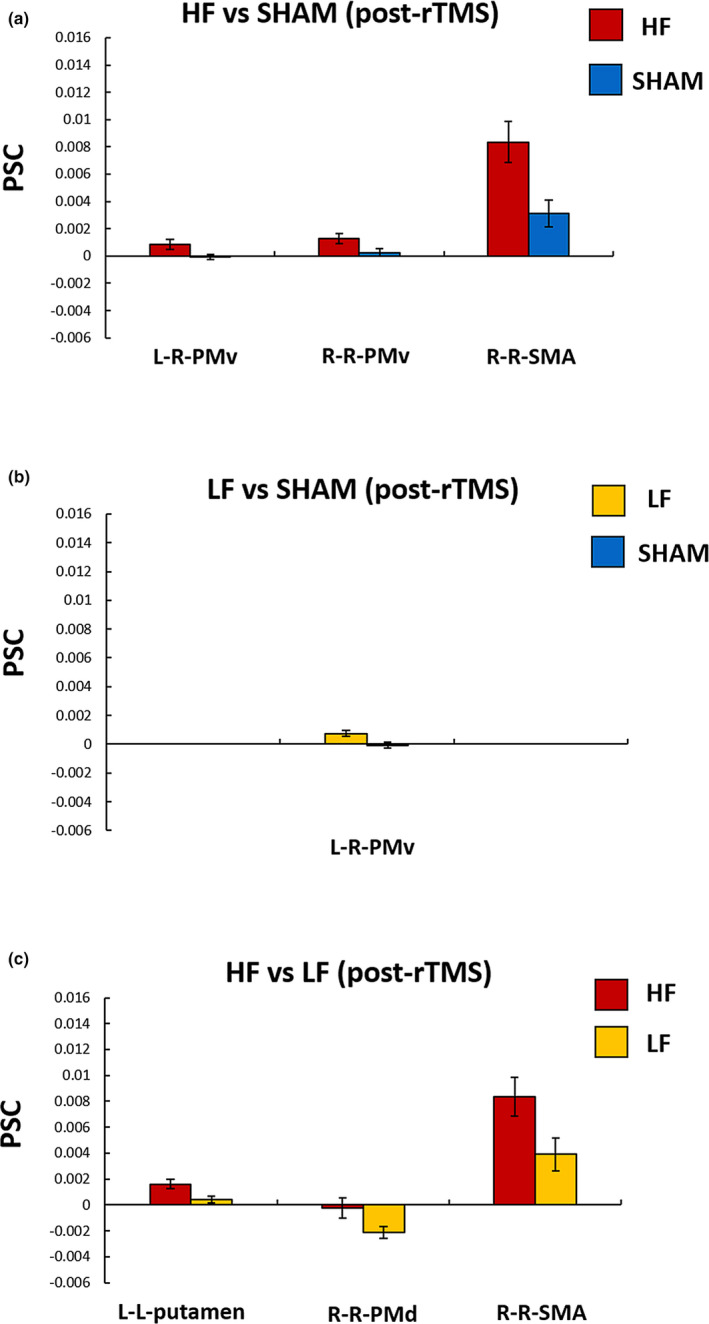
FIGURE 3.

The regions which showed significant differences in PSC after the rTMS application between groups: (a) HF versus SHAM group, (b) LF versus SHAM group, and (c) HF versus LF group. L‐R areas, the first and second letters represent the left index finger and right brain hemisphere, respectively; HF, high‐frequency group; LF, low‐frequency group; PMv, ventral premotor cortex; PMd, dorsal premotor cortex; and SMA, supplementary motor cortex. Error bars represent one strand error of the mean
