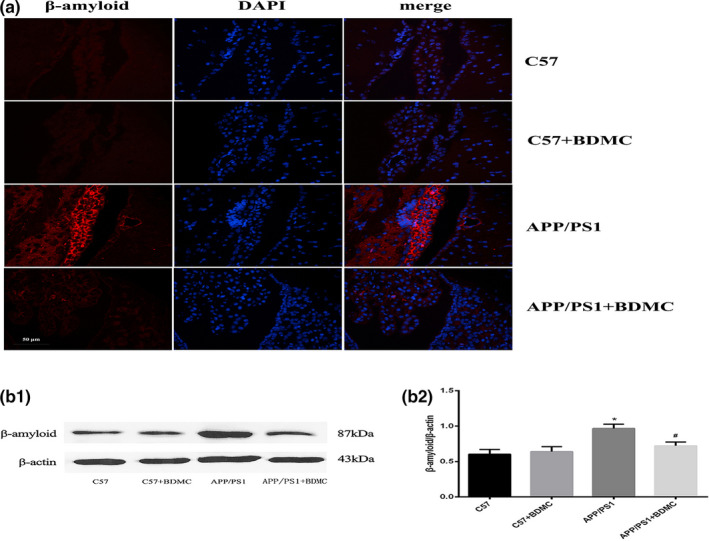
FIGURE 5.

Effects of BDMC on Aβ deposition in the C57 and APP/PS1 mice hippocampus. (a) Analysis of Aβ deposition in the hippocampus with immunofluorescence staining. From left to right: red indicates the target protein Aβ, blue indicates the neuronal nucleus, and the last column shows the image after the overlay of the above two images. (b1) Western blot analysis. (b2) Quantitative analysis of b1 Western blot. * p < .001 versus C57 mice. # p < .001 versus APP/PS1 mice
