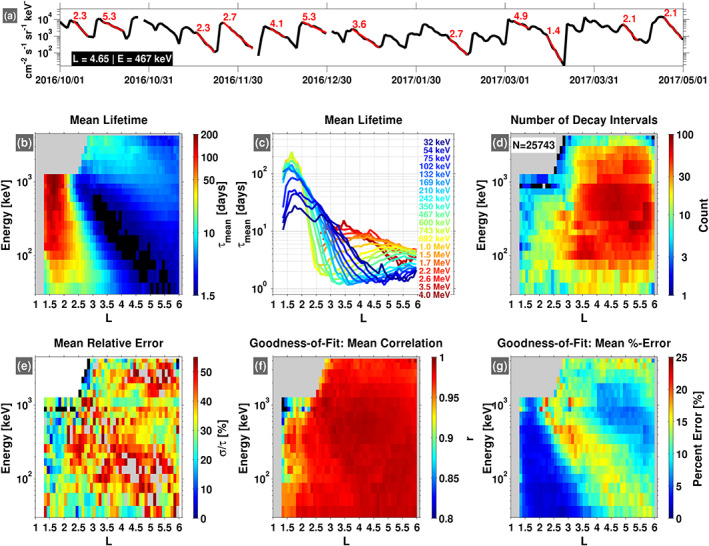
Figure 1.

Summary of the decay timescales obtained from the automated algorithm. (a) Daily‐averaged, differential flux at for 467‐keV electrons. Exponential decays identified by the automated algorithm are highlighted in red with the calculated decay (e‐folding) times indicated, in days. (b) Mean lifetimes calculated in each energy and bin (0.1 ‐width). (c) Same as panel (b) but here displayed in a line plot format. (d) The number of decay intervals identified in each energy and bin, with the total number in all bins indicated ( ). (e) The mean relative error (standard deviation of the lifetimes divided by the mean lifetime) in each energy and bin (note that gray color in this panel indicates a value above the maximum of the color scale). (f and g) Goodness‐of‐fit metrics in each energy and bin, displaying the mean linear correlation coefficient ( ) and the mean percent error between the exponential fit and the flux. In all of the color panels, a black color indicates a value below the indicated color scale.
