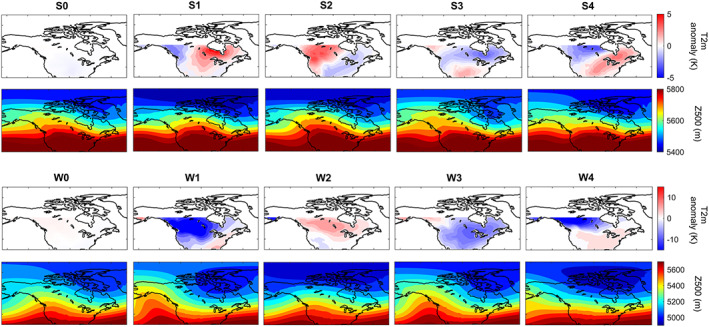
Figure 1.

Cluster centers of T2m anomalies at the onsets and Z500 patterns of 3 days earlier. The top (bottom) two rows correspond to summers (winters). S0 (W0) shows the average of T2m and Z500 patterns from days with no heat wave (cold spell). S1–S4 and W1–W4 are obtained from K‐means clustering the anomalous T2m patterns at onsets into four classes, which roughly separates the extreme events into four geographical regions: Northern Canada (S1), Western United States‐Canada (S2), Southern United States (S3), and Eastern United States‐Canada (S4) in summers and Northwest United States‐Canada (W1), Alaska (W2), Northeast United States‐Canada (W3), and Northern Canada (W4) in winters. Rows 1 and 3 show the cluster centers, while rows 2 and 4 show the average of Z500 patterns 3 days before the onsets for each cluster.
