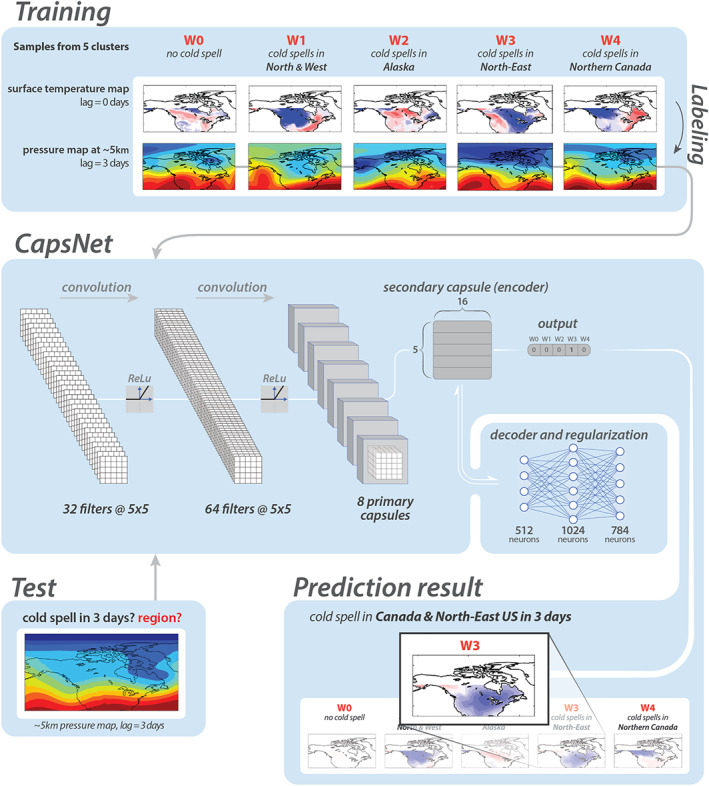
Figure 2.

Schematic of the data‐driven framework for prediction of cold spells based on Z500 patterns of 3 days earlier. Using the impact‐based autolabeling strategy, Z500 patterns are labeled W0, W1, W2, W3, or W4, depending on the cluster index of T2m 3 days ahead. The panels at the top show examples of T2m patterns at the onset and the corresponding Z500 patterns (from 3 days earlier) for each cluster. Only the Z500 patterns and their labels are inputted into the CapsNet during training. Once trained, the CapsNet can predict, from a given Z500 pattern, the T2m cluster index of 3 days later, thus predicting the occurrence and geographical region of cold spells. For the shown test example, a cold spell in W3 in 3 days is predicted. Note that for winters, Z500 patterns over a larger domain that extends across the Pacific Ocean to 145°E are inputted into the CapsNets, but a smaller domain is shown in this figure for better illustration (see Section 3.2). Separate CapsNets are trained for each season and each prediction lead time.
