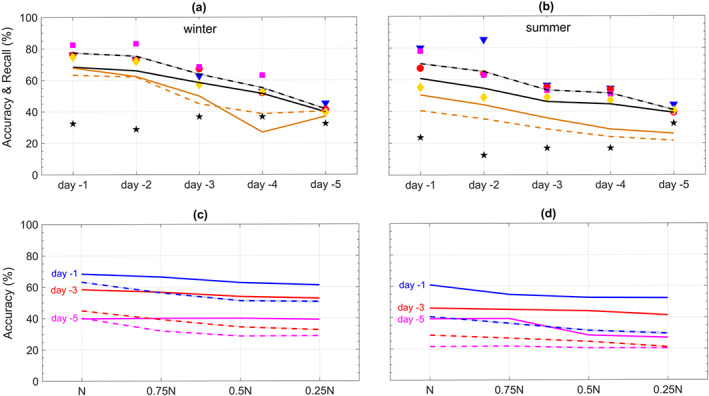
Figure 6.

Same as Figure 4 but for the performance of ConvNets and logistic regression in predicting heat waves and cold spells using both T2m and Z500 patterns at various lead times. In (a) and (b), the symbols and black lines correspond to ConvNets, while the green lines correspond to logistic regression. In (c) and (d), the solid (dashed) lines correspond to ConvNets (logistic regression).
