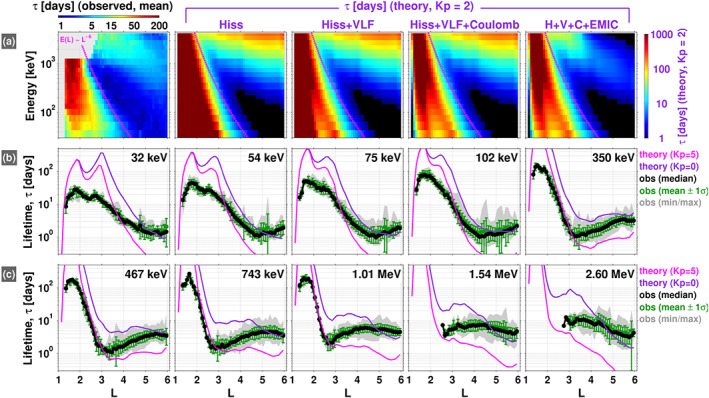
Figure 2.

(a) Observed mean lifetimes (first panel) along with the theoretical predictions for pitch angle diffusion due the indicated scattering mechanism(s). Note that the color scale is different for the observed and theoretical lifetimes (1–200 days vs. 1–1,000 days, respectively). (b, c) Same as panel (a) but presented in a line plot format, where the mean observed lifetimes are shown in green with error bars, along with the median (black), and a shaded region (grey) indicating the minimum and maximum values at each . The theoretical lifetimes in these two rows (pink and purple) are obtained from the where all of the scattering mechanisms are combined: hiss, VLF, Coulomb, and EMIC (e.g., the last panel in row (a)).
