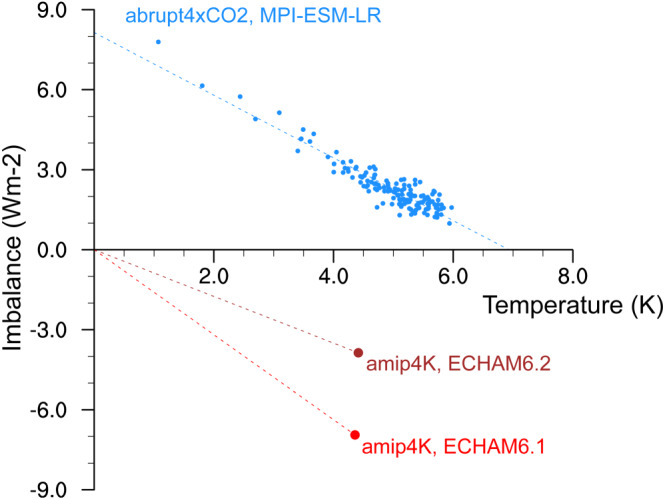
Figure 1.

Estimation of climate sensitivity by means of equation (1). Individual years of the coupled model experiment with abruptly quadrupled CO2 is shown as blue markers and a linear regression as a dashed line. Red and brown markers are the 30‐year averages in amip4K experiments with uniformly raised SSTs in two versions of ECHAM.
