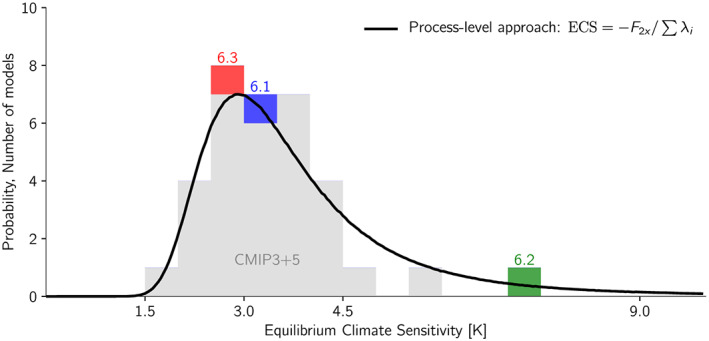
Figure 8.

Probability distribution of ECS in CMIP3 and CMIP5 models, as tabulated in Mauritsen and Stevens (2015), shown in gray shading and for ECHAM6.1, ECHAM6.2, and ECHAM6.3 in colors. The black curve is Monte Carlo sampled forcing and feedback parameters obtained from Caldwell et al. (2016), omitting near‐identical models, and assuming the forcing, and Planck, cloud, surface albedo and water vapor plus lapse rate feedback parameters are Gaussian distributed and statistically independent.
