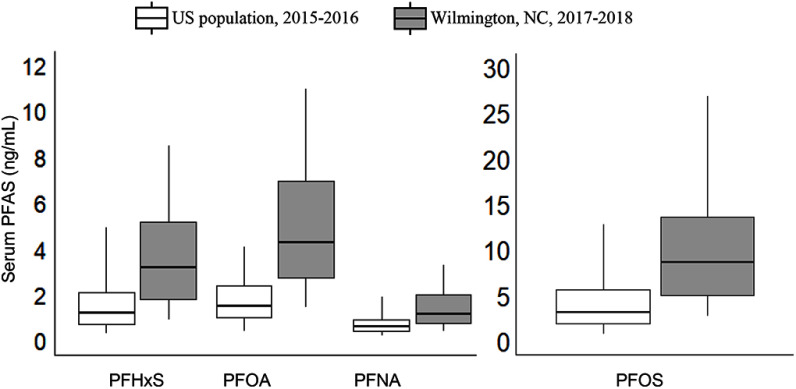
Figure 4.
Box and whisker plot of legacy PFAS concentrations (ng/mL) in sera from 344 Wilmington, North Carolina residents and the U.S. population based on NHANES data from the 2015–2016 survey year (CDC 2015–2016). Concentrations of Linear PFOA and linear PFOS were used for the U.S. population. Boxes show median concentrations and 25th and 75th percentiles; 5th and 95th percentiles are indicated by the whiskers. In the analysis of Wilmington residents’ sera, the median MRL for PFHxS, PFOA, and PFNA was , and PFOS was . For NHANES, the MRL was for the PFAS. See Table S8 for corresponding numeric data. PFHpA data are not presented because PFHpA is seldom detected in NHANES participants. For NHANES 2013–2014, which is the most recent PFHpA data available, the median was less than the MRL of . Note: MRL, method reporting limit; NHANES, National Health and Nutrition Examination Survey; PFAS, per- and polyfluoroalkyl substances; PFHpA, perfluoroheptanoic acid; PFHxS, perfluorohexane sulfonic acid; PFNA, perfluorononanoic acid; PFOA, perfluoroctanoic acid; PFOS, perfluorooctane sulfonic acid.

