
Figure 1.
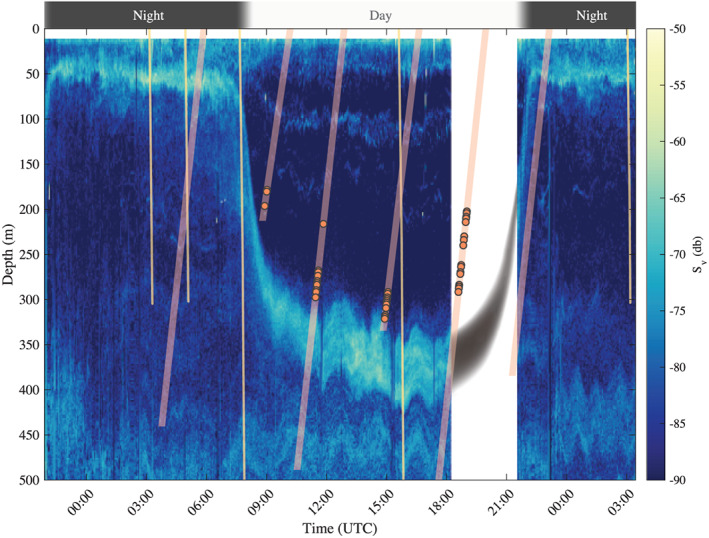
Time series of the mean volume backscattering strength ( ) at 38 kHz measured from the pole‐mounted echo sounder at the NAAMES station located at 44° 21.838 N, 43° 21.503 W occupied from 5 September 2017 21:00 to 7 September 2017 3:00 UTC. Another acoustic frequency (120 kHz) and other stations with float‐acoustics matchups are presented in the supporting information. The yellow lines correspond to the downcast of the CTD and the UVP deployed from the ship. The orange lines are the upcasts of the float, and orange circles superimposed on the profiles are FDOM spikes. Note that the first, third, and fifth orange lines are profiles of the floats from the following day. The data from these float profiles are presented in Figure 2. The slopes of the lines correspond to the profiling speed (0.08 m/s for the float and 0.5 m/s for the CTD). No acoustic backscatter was collected between 18:12 and 21:29, the gray shape indicates an estimated depth of the main DVM scattering layer, and the timing was estimated from the DVM observed at other NAAMES stations. The first 10 m of the data are removed to mask near‐field effects in the acoustics signal.