
Figure 2.
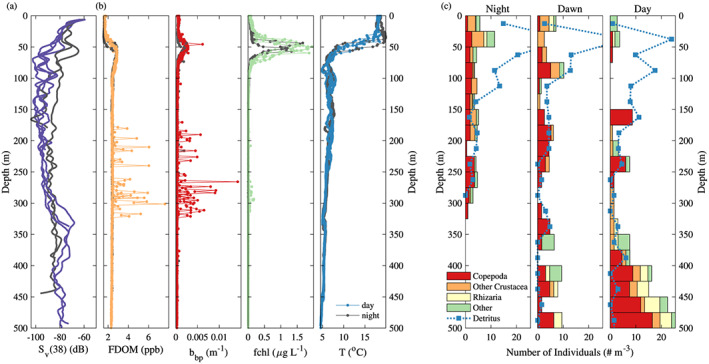
Profiles of the float, the acoustics, and the UVP at the same station presented in Figure 1. (a) Profiles of acoustic backscattering at 38 kHz ( ) from the ship. (b) Profiles of fluorescent dissolved organic matter (FDOM), particulate backscattering ( ), chlorophyll a fluorescence (fchl), and temperature (from left to right) from the float (WMO 5903108) deployed upon arrival on station showcased (Figure 1). Black lines represent to nighttime profiles while colored lines (purple, orange, red, green, and blue) correspond to daytime profiles. The time of the acoustic profiles match exactly with the time of the float profile. (c) Profiles of Copepoda (red), other Crustacea (orange), Rhizaria (yellow), other zooplankton (Annelida, Chaetognatha, Cnidaria, and unidentifiable; green), and detritus (blue lines) binned by 25 m observed by the UVP deployed from the ship. The night profile (left) is an average of the first, second, and fifth casts on station, while the dawn (middle) and day (right) profiles are based on a single cast. Some detritus concentrations are out of scale (night cast 41 particles/m and dawn cast 35 particles/m ).