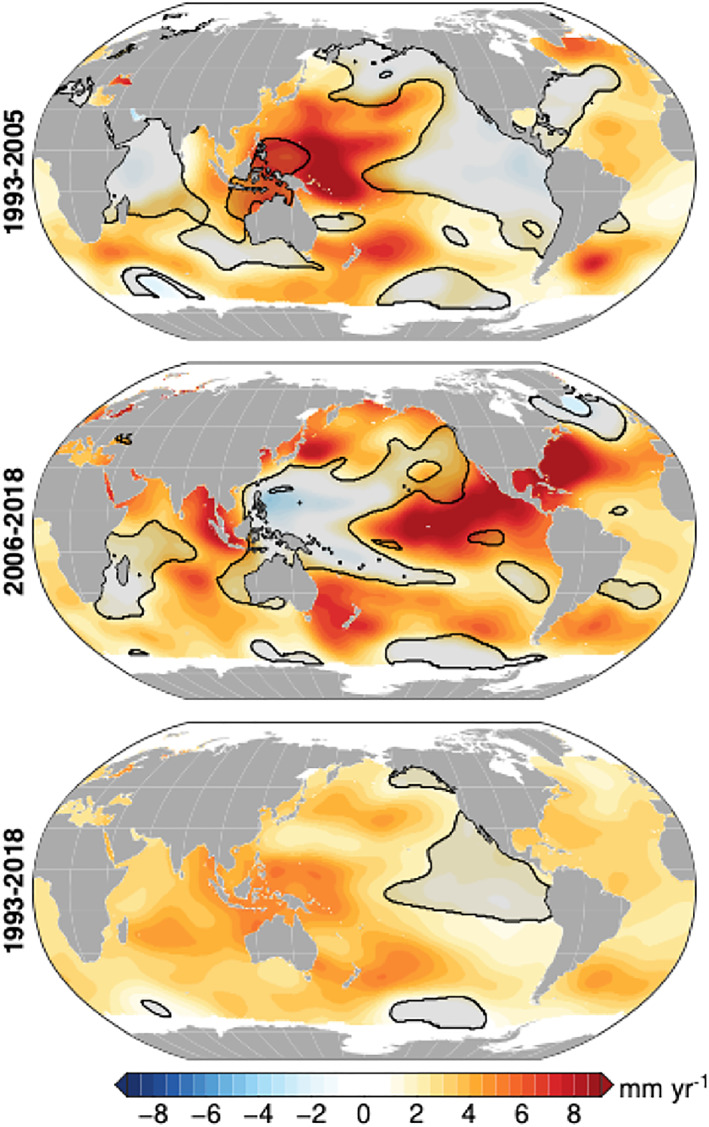
Figure 1.

Satellite altimeter‐measured regional sea‐level trend patterns from (top) 1993–2005, (middle) 2006–2018, and (bottom) 1993–2018. Black contours and gray shading denote areas where the estimated trend is not significant at the 95% confidence level.
