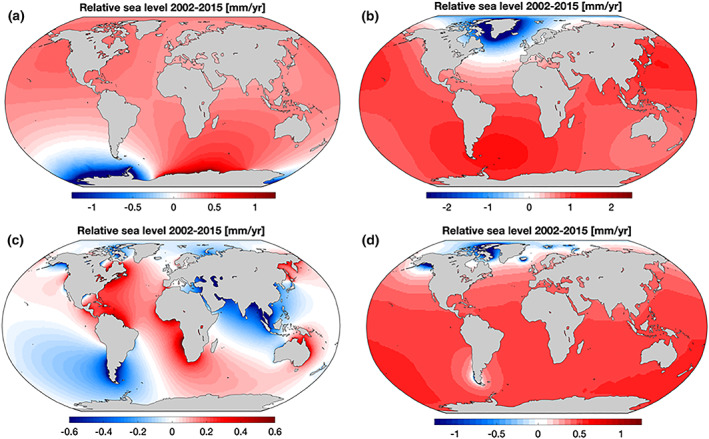
Figure 3.

Contribution to relative sea‐level rise (mm/year) from 2002 to 2015 from (a) Antarctica Ice Sheet mass loss, (b) Greenland Ice Sheet mass loss, (c) terrestrial water storage variability, and (d) glacier mass loss. Adapted from Adhikari and Ivins (2016).
