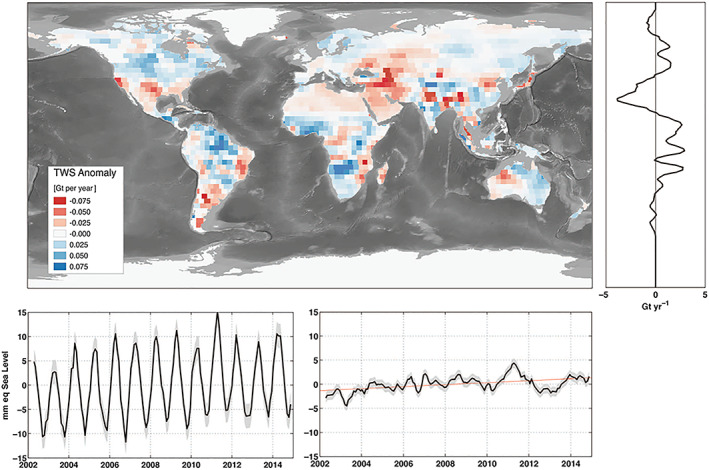
Figure 5.

An example of trends in land water storage from GRACE observations, April 2002 to November 2014. Glaciers and ice sheets are excluded. Shown are the global map (gigatons per year), zonal trends, and full time series of land water storage (in mm yr−1 SLE). Following methods details in Reager et al., (2016), GRACE shows a total gain in land water storage during the 2002–2014 period, corresponding to a sea‐level trend of −0.33 ± 0.16 mm yr−1 SLE. These trends include all human‐driven and climate‐driven processes in Table 2 and can be used to close the land water budget over the study period. From Reager et al. (2016), reprinted with permission from AAAS.
