Figure 6.

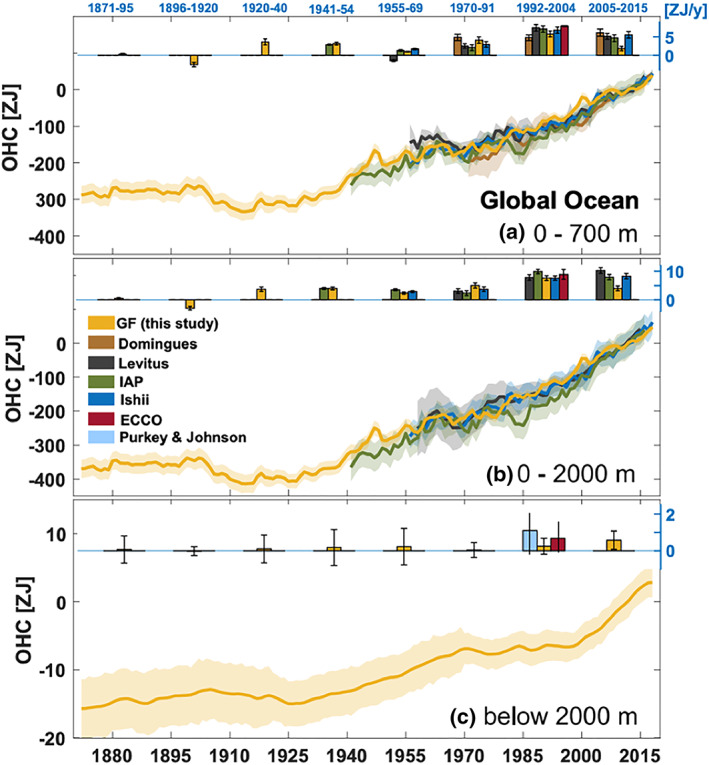
Global ocean heat content time series and trends for Green's functions and observational estimates relative to 2006–2015 for different ocean depths: (a) 0–700 m, (b) 0–2000 m, and (c) below 2000 m. From Zanna et al. (2019).

Global ocean heat content time series and trends for Green's functions and observational estimates relative to 2006–2015 for different ocean depths: (a) 0–700 m, (b) 0–2000 m, and (c) below 2000 m. From Zanna et al. (2019).