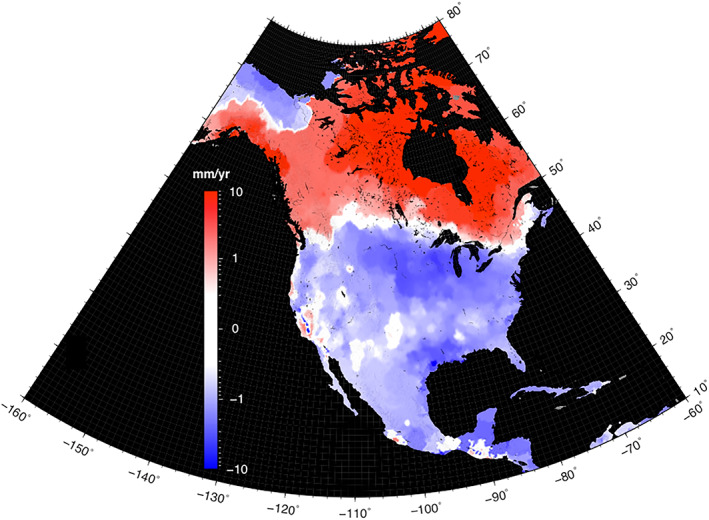
Figure 7.

Rates of vertical land motion from GNSS observations made at over 6,000 stations across North America. VLM field is derived using MIDAS velocities in the ITRF 2014 reference frame and GPS imaging interpolation (Blewitt et al., 2018; Hammond et al., 2016). Note that logarithmic color scale is used to highlight both large and small VLM signals, with red representing upward and blue downward motion in mm/yr.
