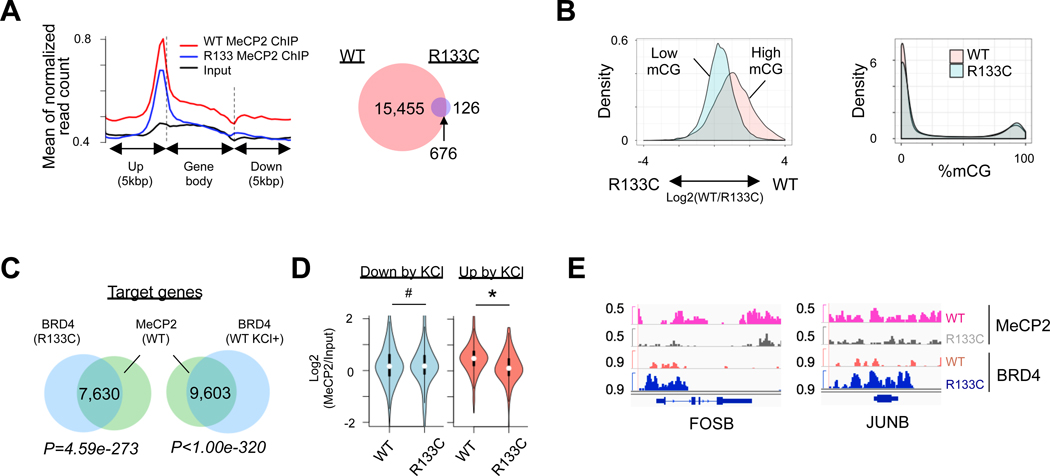
Figure 4. MeCP2 Mutation Leads to Increase of BRD4 Binding at mCpG Sites.
(A) Distribution of MeCP2 binding in gene body and flanking region (left), and Venn diagram showing overlaps of MeCP2 peaks between MeCP2-WT and MeCP2-R133C INs (right). Left: p=2.2e-16. Right: p=0.1307.
(B) Difference of MeCP2 binding to highly- or lowly-methylated CpG islands (CpGIs) between MeCP2-WT and MeCP2-R133C INs (left panel), and difference of their mCGs on CpGIs (right panel). CpGIs were classified by high (>80%) and low mCGs (<20%). Left: p=2.2e-16. Right: p=0.1307.
(C) Venn diagram showing common target genes between WT MeCP2 and BRD4 in MeCP2-R133C INs, and between WT MeCP2 and BRD4 in KCl-depolarized MeCP2-WT INs.
(D) Chromatin binding of MeCP2 in KCl-suppressed (<1.5 fold) or KCl-induced genes (>1,5 fold) in MeCP2-WT and MeCP2-R133C INs. # P=0.3621, * P=3.295e-9.
(E) Snapshots of MeCP2 and BRD4 binding peaks in representative IEG locus in MeCP2-WT and MeCP2-R133C INs.
See also Figure S6.

