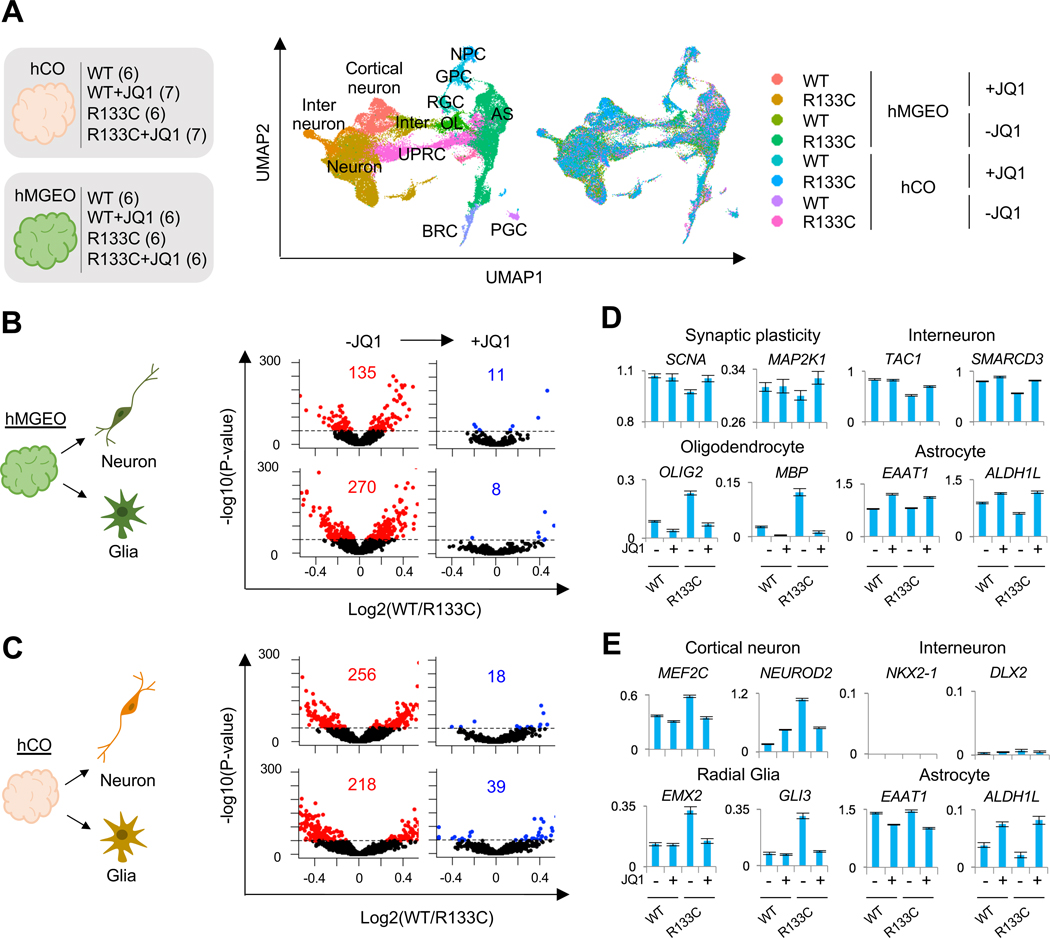
Figure 6. JQ1 Rescues RTT cells in Human Brain Organoids.
(A) tSNE plot of single cells distinguished by cluster annotations. Numbers in brackets on the left indicate organoid quantities used for each condition. Within each condition, organoids (day 77 ~ day 86, see methods for details) were collected from 2 different culture dishes, pooled together, and dissociated for scRNA-seq. For drug treatment, 75 nM JQ1 was supplemented to the media starting from day 25 until the date of sample collection. CN: cortical neuron; IN: interneuron; RGC: radial glia cell; AS: astrocyte; MAS: mature astrocyte; NPC: neural progenitor cell; OPC: oligodendrocyte progenitor cell; iOL: immature oligodendrocyte; OB-like cell: osteoblast-like cell.
(B and C) Gene dysregulation in MeCP2-R133C neuron or glia clusters derived from hMGEOs (B) or hCOs (C) with or without JQ1 treatment. The dysregulation score (= −log10(p-value) by two-side T test comparing MeCP2-WT and MeCP2-R133C cells is plotted.
(D) Expression patterns of representative genes for cell type specification in hMGEO-derived cells. Cell types of each row correspond to the same row delineated in B.
(E) Expression patterns of representative genes for cell type specification in hCO-derived cells. Cell types of each row correspond to the same row delineated in C.
See also Figure S7.

