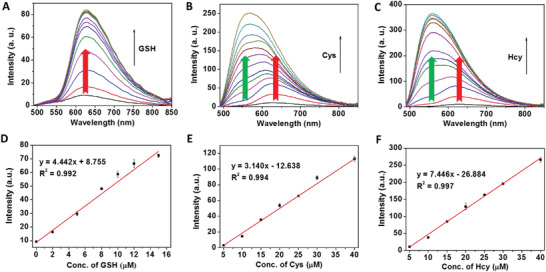
Figure 2.

Emission spectra of Ru‐NBD (10 × 10−6 m) in the absence and presence of different concentrations of GSH A) (0 × 10−6, 2 × 10⁻⁶, 5 × 10⁻⁶, 8 × 10⁻⁶, 10 × 10−6, 12 × 10−6, 15 × 10−6, 20 × 10−6, 30 × 10−6, 50 × 10−6, 100 × 10−6, 150 × 10−6, and 200 × 10−6 m), B) Cys (0 × 10−6, 5 × 10⁻⁶, 10 × 10−6, 15 × 10−6, 20 × 10−6, 25 × 10−6, 30 × 10−6, 40 × 10−6, 60 × 10−6, 80 × 10−6, 100 × 10−6, 150 × 10−6, and 200 × 10−6 m) and Hcy (0 × 10−6, 5 × 10⁻⁶, 10 × 10−6, 15 × 10−6, 20 × 10−6, 25 × 10−6, 30 × 10−6, 40 × 10−6, 60 × 10−6, 80 × 10−6, 100 × 10−6, 150 × 10−6, and C) 200 × 10−6 m in 50 × 10−3 m Tris‐HCl buffer (pH 7.4). Linear correlation of emission intensity at D) 628 nm and 540 nm E,F) against the concentration of D) GSH, E) Cys, and F) Hcy.
